Introduction
Location Map
Base Maps
Database Schema
Conventions
GIS Analyses
Glossary
Flowchart
GIS Concepts
Results
Conclusions
References
GIS Analysis
Key Concepts
Based on available literature and on statistical analysis of field data, we decided that our model needed to include several key components in order to accurately represent potential aspen habitat. These included:
1- Soil data
2- Climatic data
3- Elevation and aspect
Data Acquisition
We obtained the above datasets from the White River National Forest (soil survey data), the PRISM Climate Group (Maximum monthly temperatures and precipitation for June-September, 1999-2010), and the U.S. Geological Survey's National Elevation Dataset (10-meter Digital Elevation Model). All datasets required some pre-processing. This included: conversion to raster format (soil survey data); conversion of text files to ASCII format (PRISM data); creating a mosaic of several raster layers into a single dataset (Digital Elevation Model).
Data Modification and Development
PRISM Data- Monthly Precipitation:
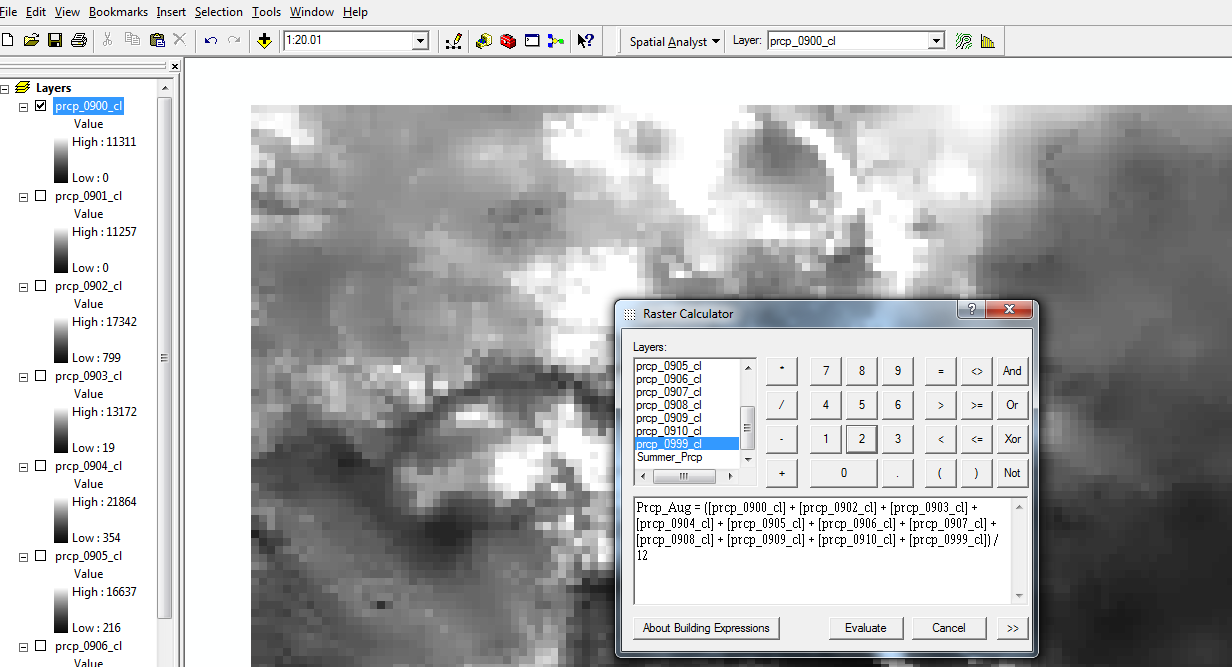
Monthly precipitation data was downloaded from as nationwide, compressed, monthly datasets for June-September, 1999-2010. We clipped the unprojected data with an unprojected state boundary shapefile. The clipped datasets were assigned a projection (UTM NAD 83, Zone 13 North) prior to geoprocessing. Each monthly precipitation dataset was averaged across years, resulting in four datasets (Precip June, Precip July, Precip August, and Precip September). To capture the variation in precipitation from year to year, each monthly dataset was subtracted from the twelve year average, and then summed, resulting in a single raster dataset of precipitation differences for each month. These four data sets (the sum of differences for June, July, August, and September), were then summed, resulting in a single raster dataset with summer precipitation differences. We then reclassified the dataset using Jenks’ Natural Breaks method into five categories.
PRISM Data- Maximum Daily Temperature:
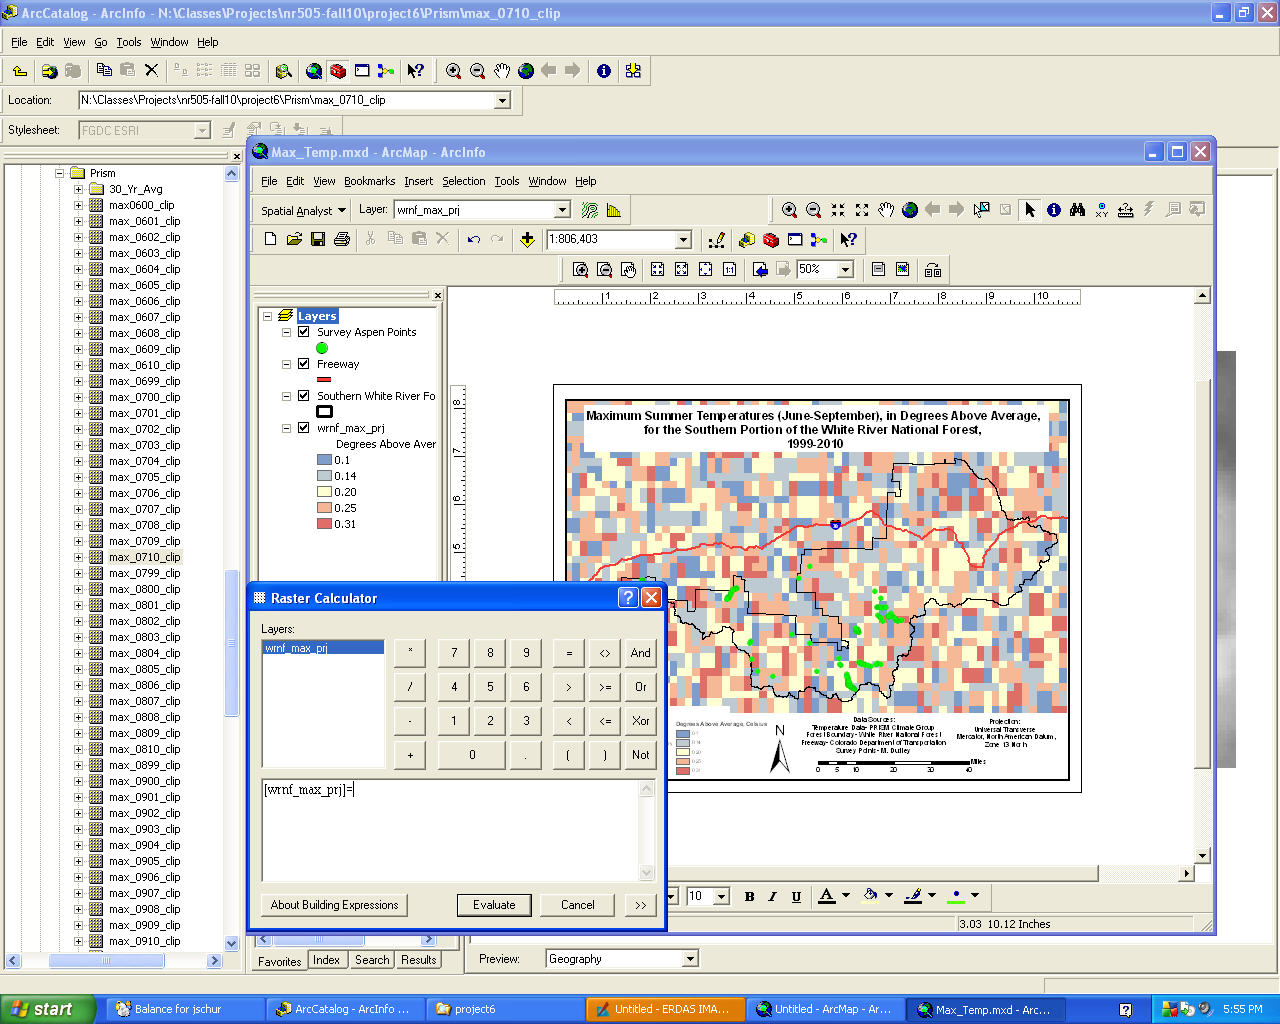
Maximum monthly temperature data was downloaded as compressed, monthly datasets for June-September, 1999-2010. The unprojected dataset was clipped with an unprojected state boundary shapefile. The clipped datasets were assigned a projection (UTM NAD 83, Zone 13 North) prior to geoprocessing. Each monthly maximum temperature dataset was averaged across years, resulting in four datasets (Average Max June, Average Max July, Average Max August, and Average Max September). To capture the variation in maximum temperature from year to year, each monthly dataset was subtracted from the twelve year average, and then summed, resulting in a single raster dataset of temperature differences for each month. These four data sets (the sum of differences for June, July, August, and September), were then summed, resulting in a single raster dataset with summer temperature differences. We then reclassified the dataset using Jenks’ Natural Breaks method into five categories.
Soil Survey Data:
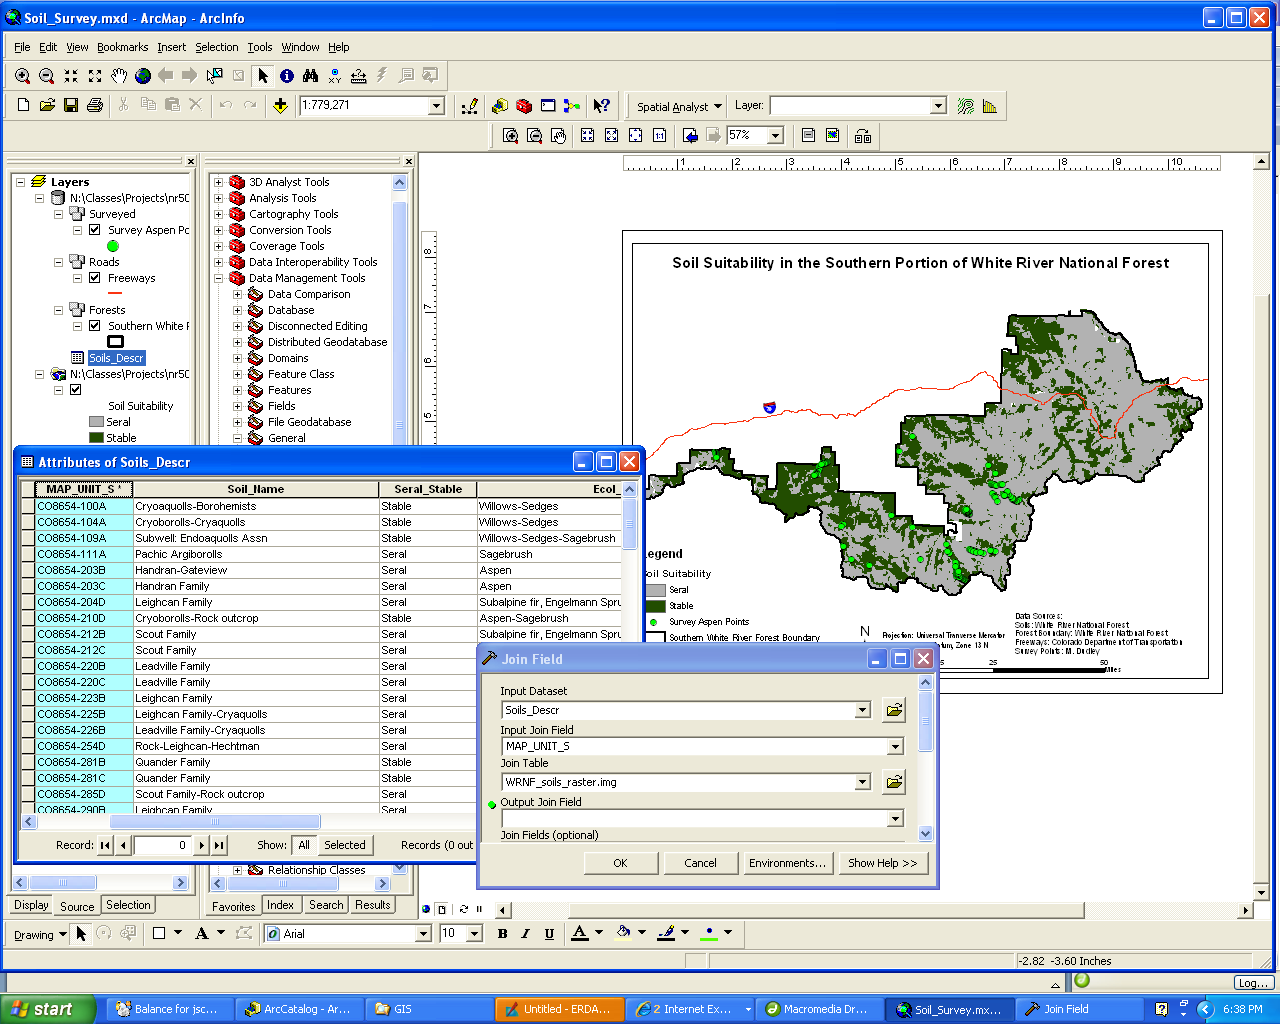
Soil data was downloaded in ArcGIS shapefile format, which we converted to a GRID format. Data was only available for the southern portion of the forest. We created a non-spatial table and populated it with information from the soil survey dictionary, a PDF-format document which accompanied the shapefile. This table included: map unit names, ecological units, dominant soil names, climatic zones, and surface soil depth and color. We then joined the non-spatial table to the gridded soil data by the map unit name field. Specific soils were selected and classified as either 'Stable' or ‘Seral’.
Digital Elevation Model: Creating a Mosaic
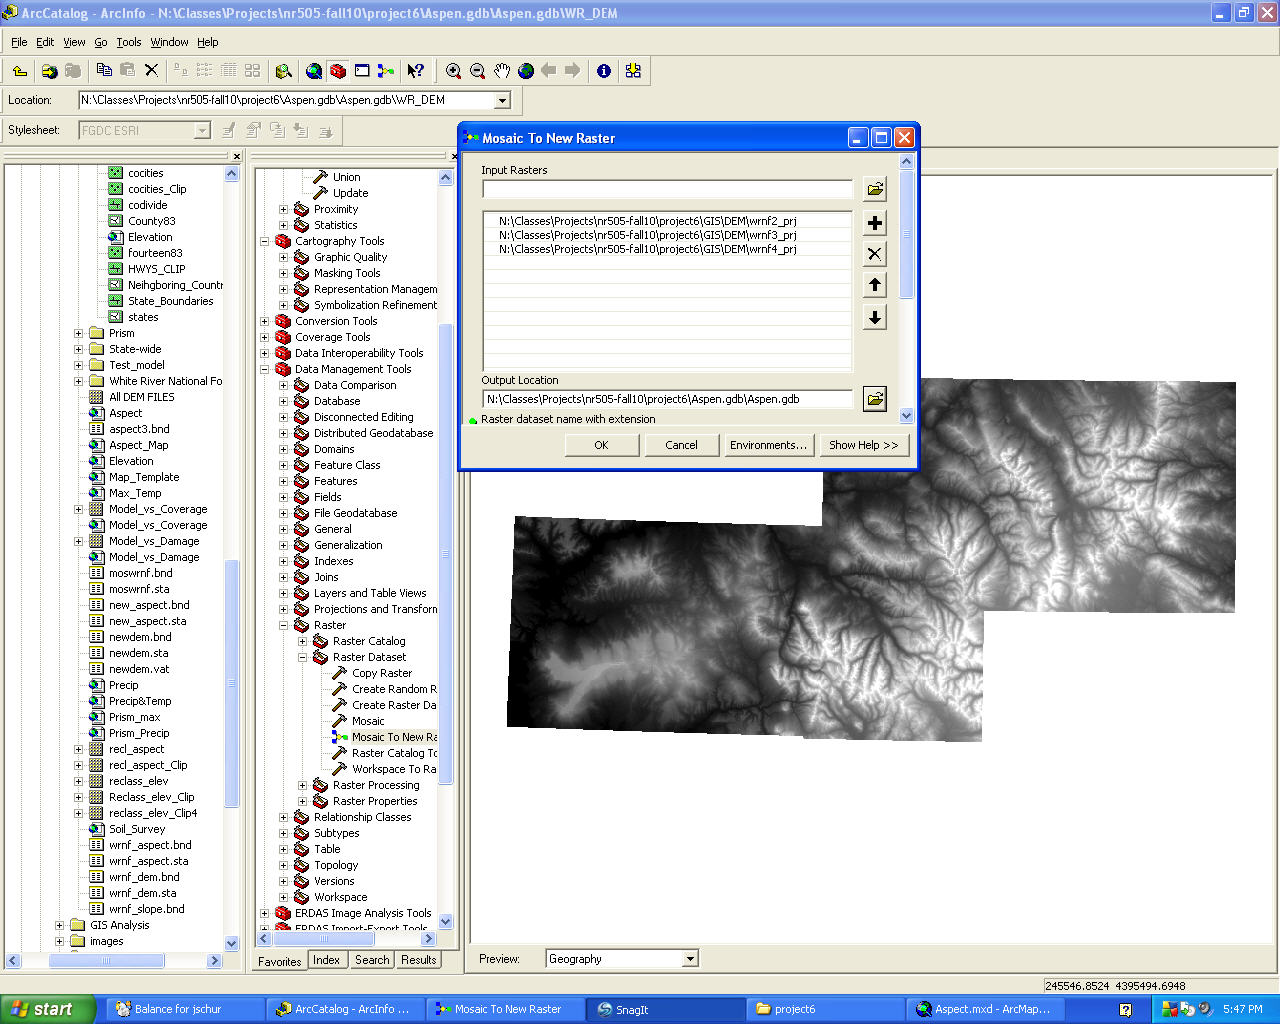
We created a single DEM from several smaller digital elevation model using the 'Mosaic' tool in ArcToolbox. This resulted in a single, seamless DEM for the entire study area.
Digital Elevation Model: Deriving Aspect
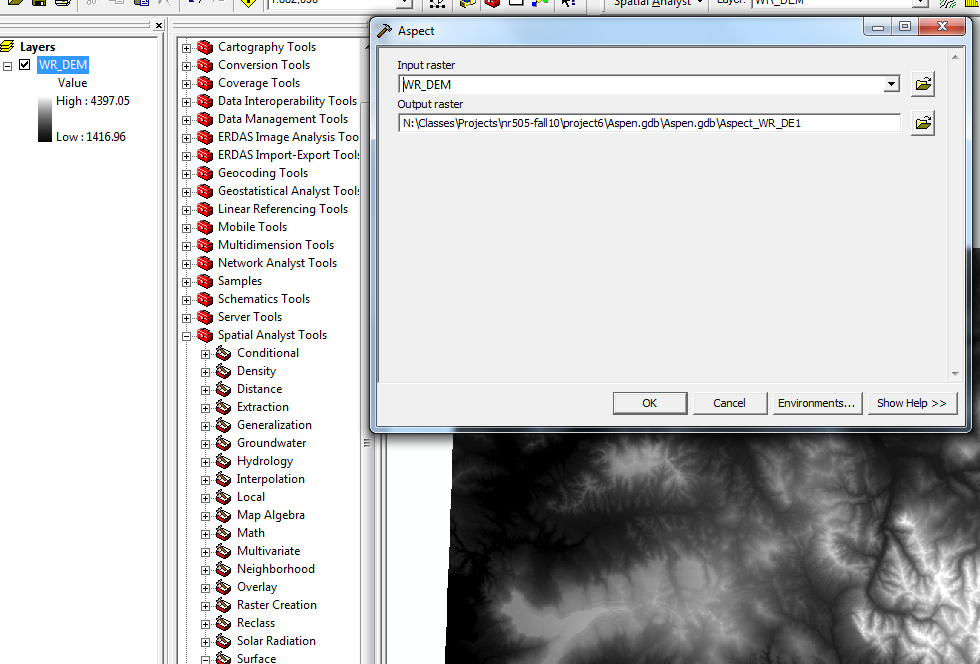
Aspect was derived from a 10-meter resolution Digital Elevation Model. Based on field data collected in 2009 and 2010, aspen appear to grow best on north-facing aspects, and worst on west-facing aspects. Aspen on south- or east-facing aspects were in better shape than those on west-facing slopes, and worse than those on north-facing aspects. Thus, for this analysis, we reclassified the aspect data into three categories- north, south and east, and west.
Digital Elevation Model: Reclassifying Elevation
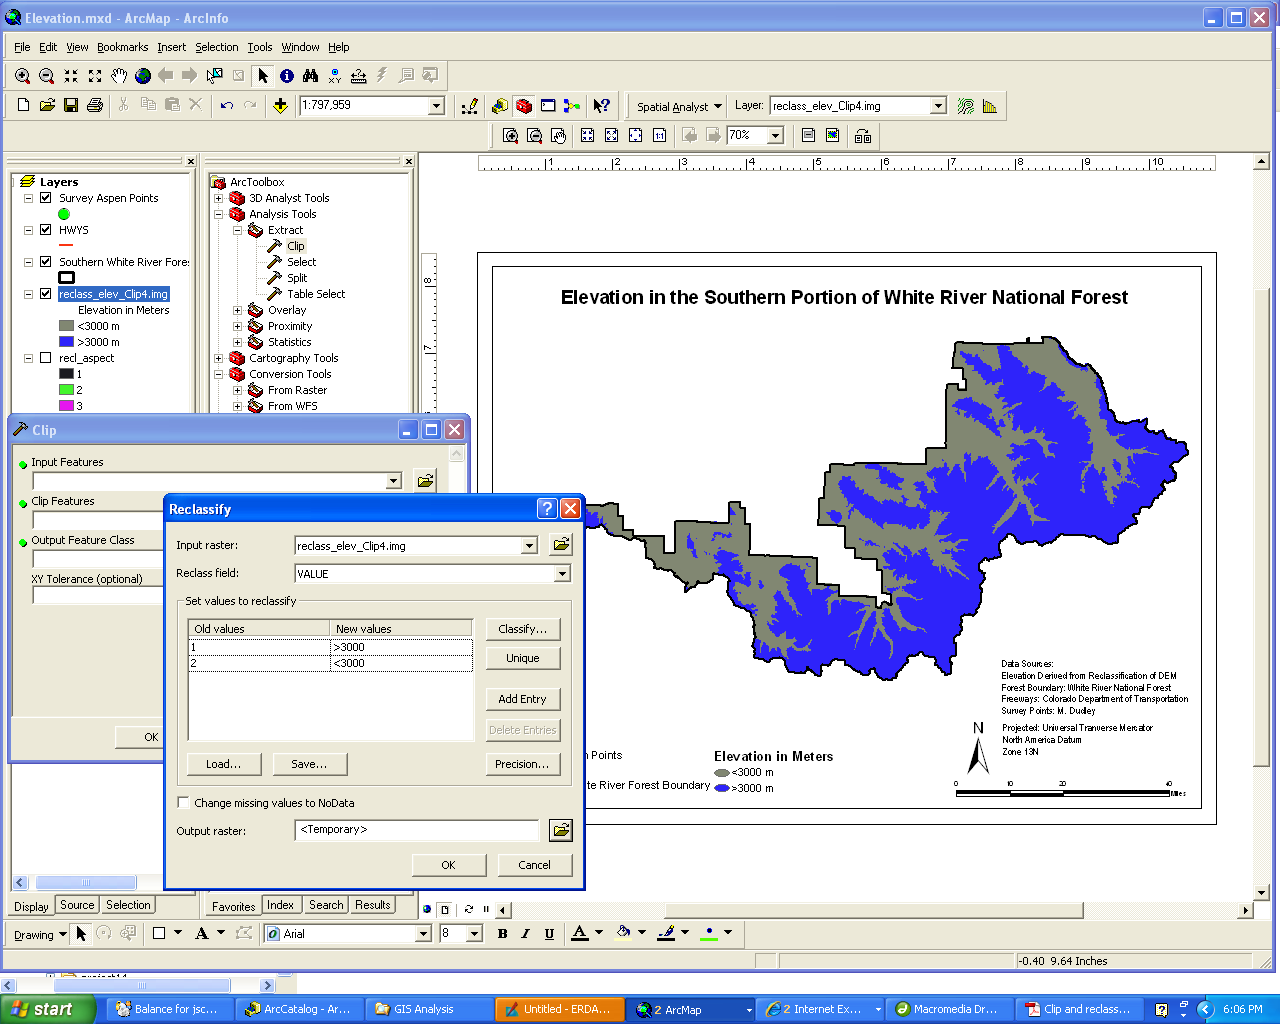
Based on field data collected in 2009 and 2010, aspen appear to grow better on higher-elevation sites; analysis indicates that stands located at elevations of 3000 meters or greater have larger proportions of living adult trees than those at lower elevations.
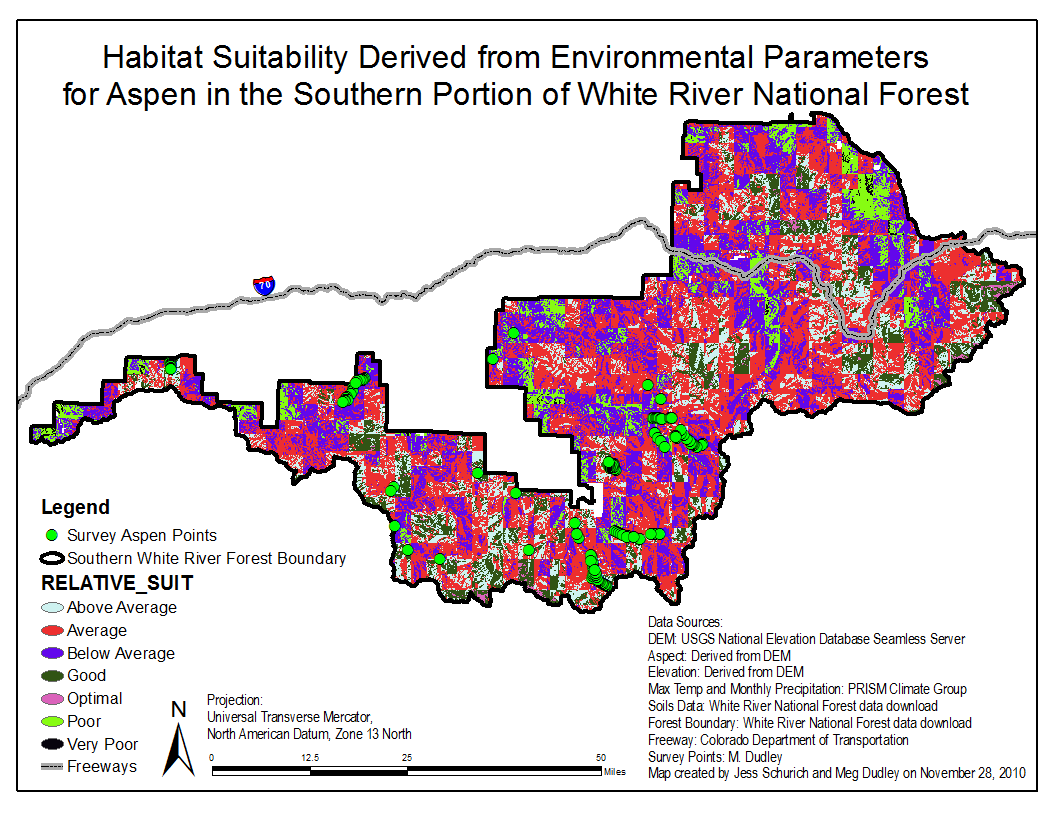
Overview of Final Model with Parameters :
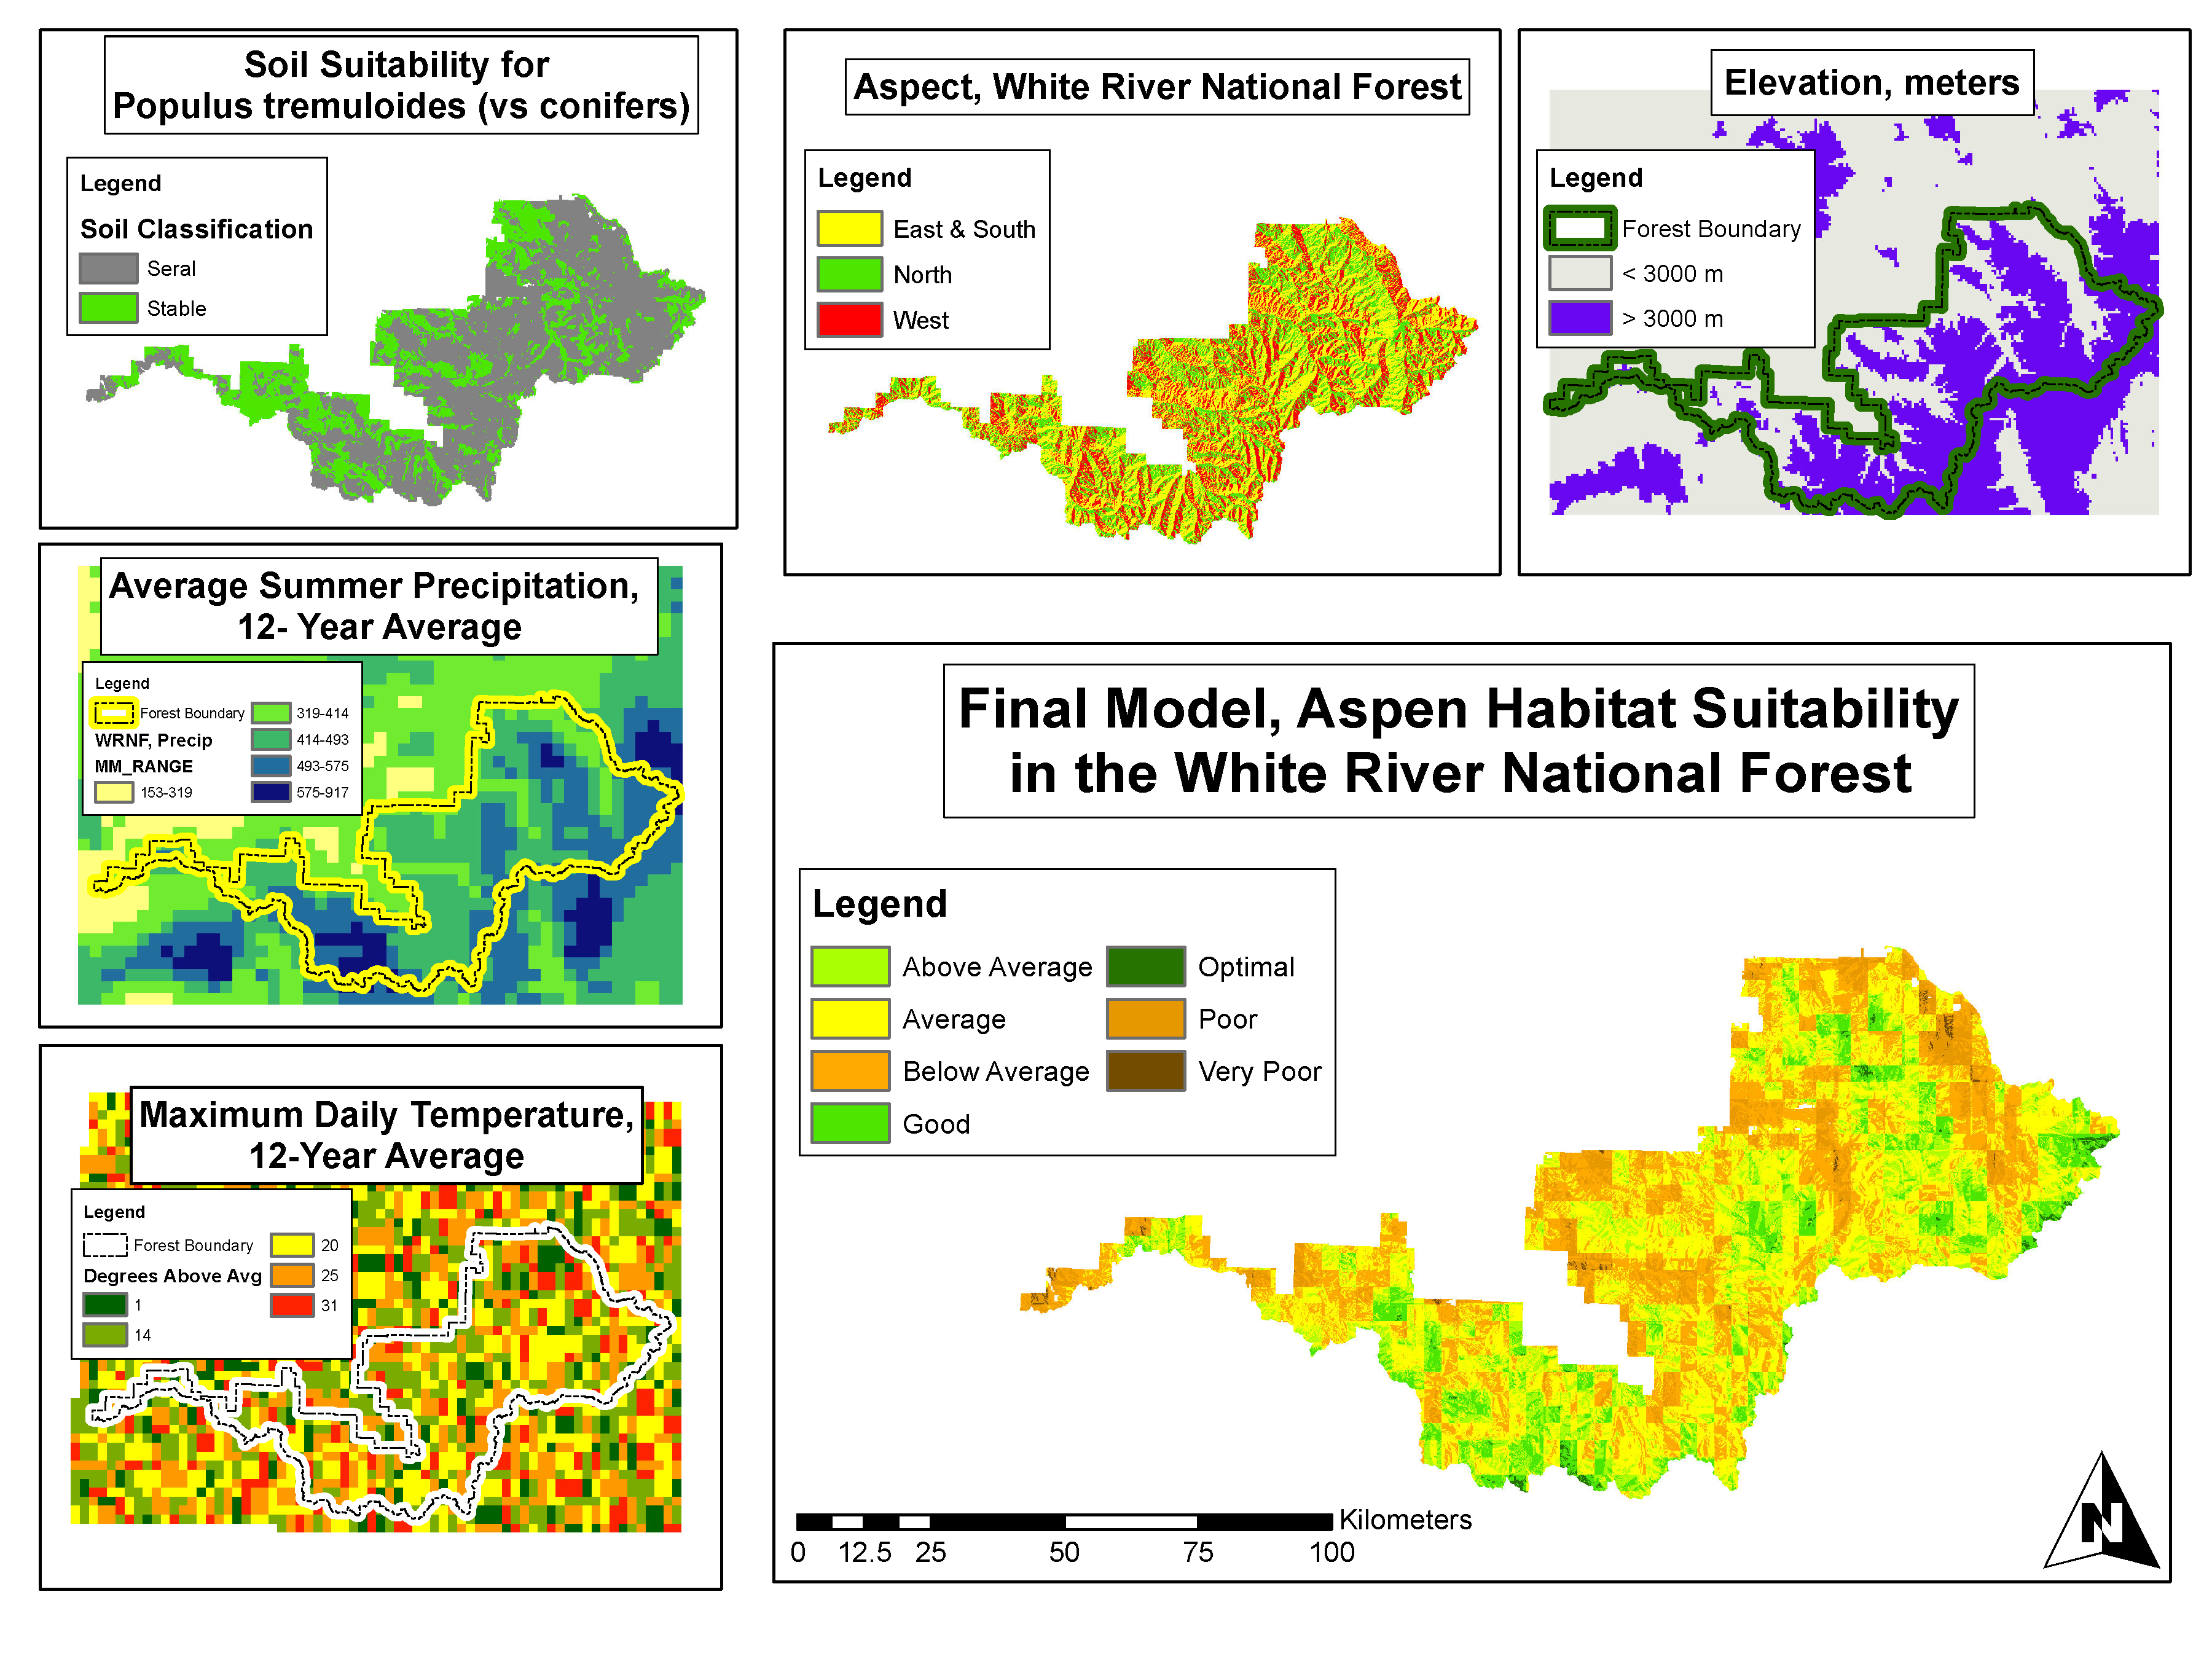 All five layers were summed together using Raster Calculator to produce a single dataset with seven categories of habitat suitability, where category 1 is 'very poor', and category 7 is 'optimal' suitability for aspen.
Final Model with Survey Points: