Introduction
Location Map
Base Map
Database Schema
Conventions
GIS Analyses
Flowchart
GIS Concepts
Results
Conclusion
References
![]()
Results
NDVI
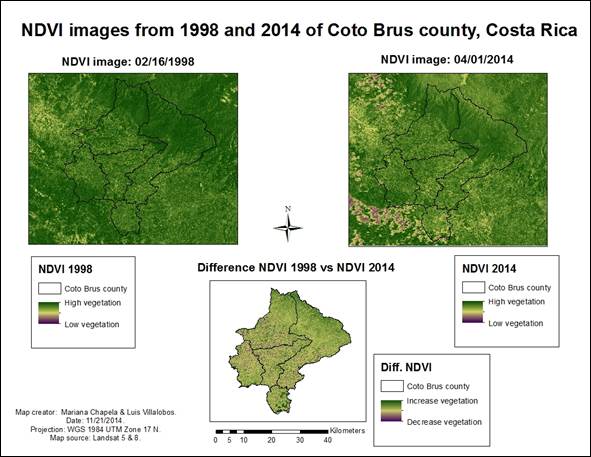
Change in vegetation in Coto Brus County from 1998 to 2014.
Code |
Hectares |
1 |
92839,36 |
2 |
1437,05 |
A decrease in vegetation was observed in 92839.36 hectares between 1998 and 2014.
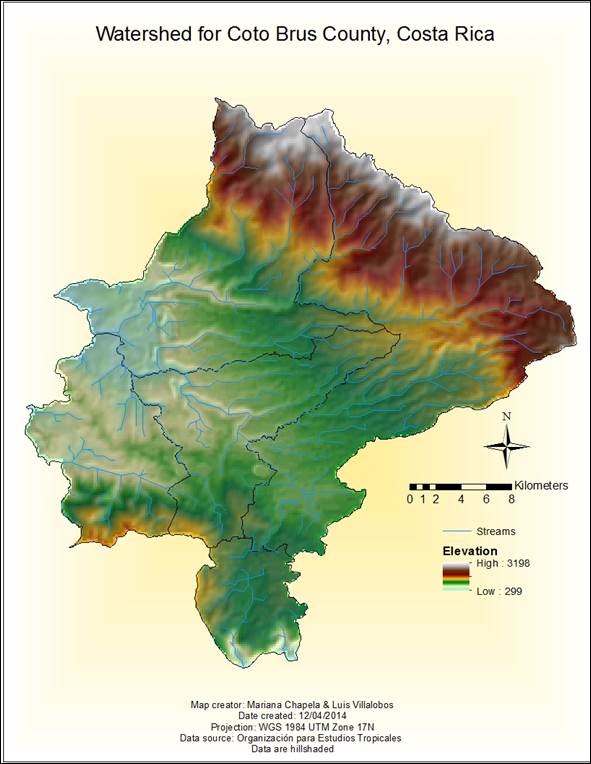
Watershed
The topographic data was the base document to create the following watershed for Coto Brus County.
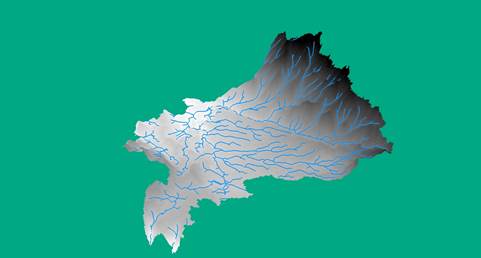
The watershed was transferred to ArcScene so it could be seen as a 2D image.
Slope pastureland
Pastureland elevation reclassified into areas up to 1000 m and >1000 m of elevation.
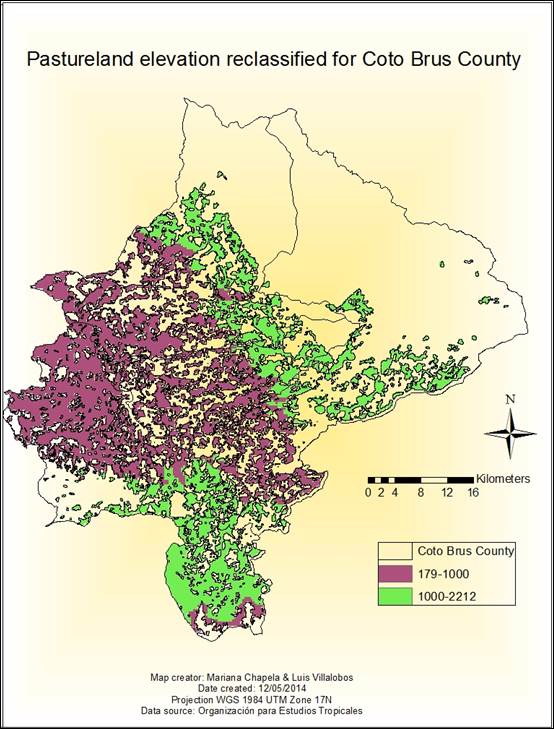
The pastureland elevation reclassified was divided into two categories as follows:
Category (m) |
Count |
Hectares |
179-1000 |
6852 |
19802 |
>1000 |
5033 |
14545 |
Total |
11885 |
34348 |
Pastureland slope reclassified into areas up to 10 degrees and > 10 degress.

The pastureland slope reclassified was also divided into two categories as shown in the next table:
Category (degrees) |
Count |
Hectares |
0-10 |
10121 |
29250 |
>10 |
1764 |
5098 |
Total |
11885 |
34348 |
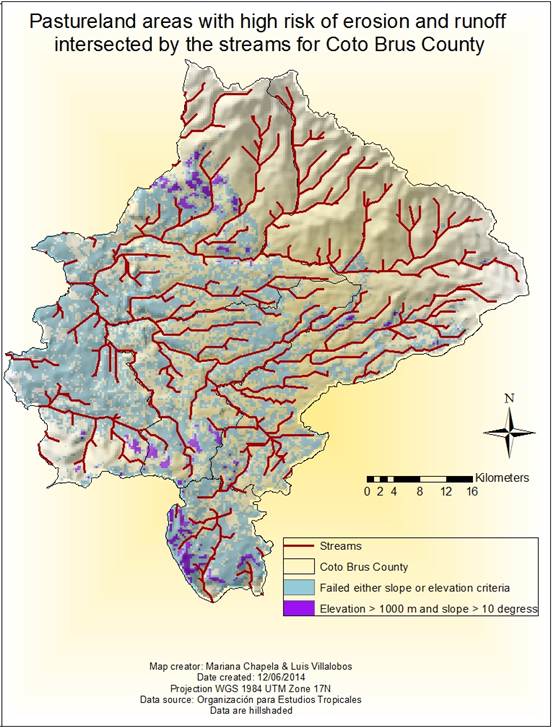
After using the raster calculator to estimate the areas that met both requirements of elevation and slope, we could assess the pastureland areas that are prone to erosion and runoff in the Coto Brus County.
Category |
Count |
Hectares |
Failed either slope and/or elevation requirements |
11315 |
32700 |
Elevation > 1000 and slope > 10 degrees |
570 |
1648 |
Total |
11885 |
34348 |
Pastureland areas that met the requirements established in the reclassified slope and elevation raster files.
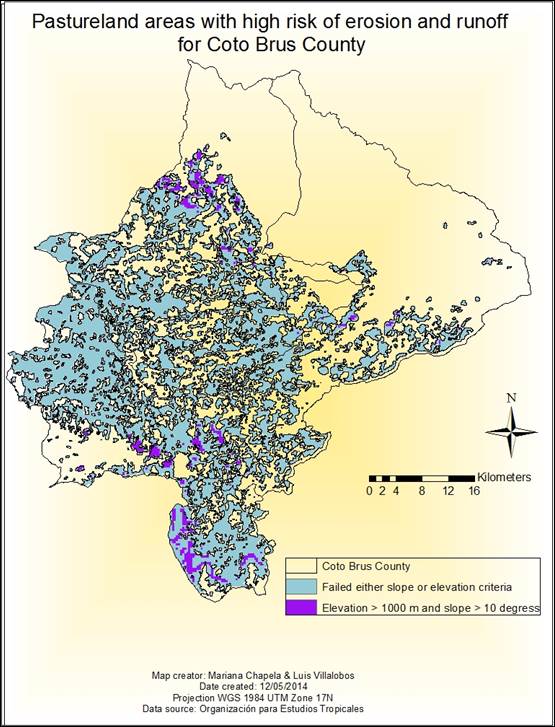
The number of hectares with high risk to be eroded and heavily affected by cattle trampling represents 4.79% of the total pastureland areas in Coto Brus County. The following map combines the areas prone to erosion and runoff plus the streams that flow along the watershed. The areas with both high elevation and slope are likely to be headwaters of the watershed. Communities in the lowlands as well as surrounding areas can be influenced by the management that ranchers apply in their pastoral lands.