Introduction
Location Map
Base Map
Database Schema
Conventions
GIS Analyses
Flowchart
GIS Concepts
Results
Conclusion
References
![]()
GIS Concepts
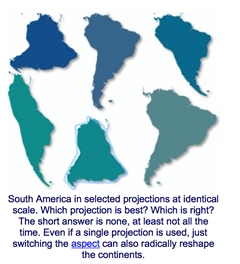
Projection
An important issue in cartography is to solve how to project, which means how to transfer the points from a spherical surface (like the Earth) onto flat surfaces.
http://www.progonos.com/furuti/MapProj/Normal/TOC/cartTOC.html
A map projection is a mathematical transformation of the geographic coordinates of locations on the surface of a sphere into locations on a plane surface. With the projections, it was also created the Projected Coordinate System. A coordinate system consists in a reference that allows to represent geographic points in a coherent, comprehensive, and common framework. Each coordinate system is identified by a measurement system (geographic or projected, a measurement unit (e.g., degrees, meters, etc), and spheroid, dantum and projection parameters (Theobald, 2009).
Projections always produce some sort of distortion. So, depending on the purpose of the map, some distortions might be acceptable while others might be not. For this reason is that different map projections exist in order to preserve some properties of the sphere-like body in regards of other properties (http://en.wikipedia.org/wiki/Map_projection). Therefore, when we compare different maps or data sets, we have to make sure that they are in the same (or complimentary) projections, so the comparison is accurate.
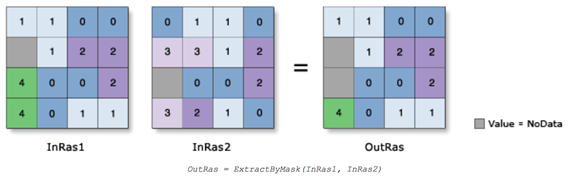
Extract by Mask
It’s a tool from the Spatial Analyst toolbox. What it does is to extract the cells of a raster that correspond to the areas defined by a mask.
http://resources.arcgis.com/en/help/main/10.2/index.html#//009z0000002n000000
Topo to Raster
It’s a tool from the Spatial Analyst toolbox. Interpolates a hydrologically correct raster surface from point, line, and polygon data.
When the input feature type is CONTOUR, the algorithm first generates a generalized morphology of the surface based on the curvature of the contours. The algorithm then implements the contours as a source of elevation information. Contours are best suited for large-scale data where the contours and corners are reliable indicators of streams and ridges. At smaller scales it can be just as effective, and less expensive, to digitize corner points of contours and use them as an input point feature class.
http://resources.arcgis.com/en/help/main/10.2/index.html#//009z0000006s000000
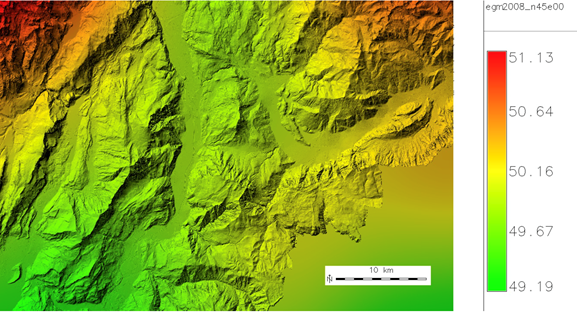
Digital Elevation Model (DEM)
A DEM is a raster representation of continuous elevation values over a topographic surface by a regular array of z-values, referenced to a common datum. They are usually used to represent terrain relief.
http://support.esri.com/en/knowledgebase/GISDictionary/term/DEM
The resolution (distance between sample points) determines the accuracy of the DEM data. Some other factors that affect the accuracy are the data type (floating or integer points) and the sampling surface of the original DEM. Errors can be classified as sinks or peaks. Sinks are areas surrounded by higher elevation values, corresponding to internal drainage. On the other hand, peaks are areas surrounded by lower value cells. They are more common and affect less when calculating flow direction. These errors, specially sinks, have to be removed before continue with the analysis of the surface
http://resources.arcgis.com/en/help/main/10.1/index.html#//009z0000005n000000
http://grasswiki.osgeo.org/wiki/File:Trentino_egm2008_map_5m_resampled.jpg
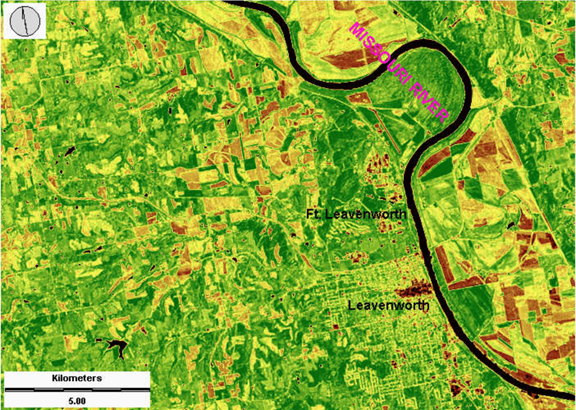
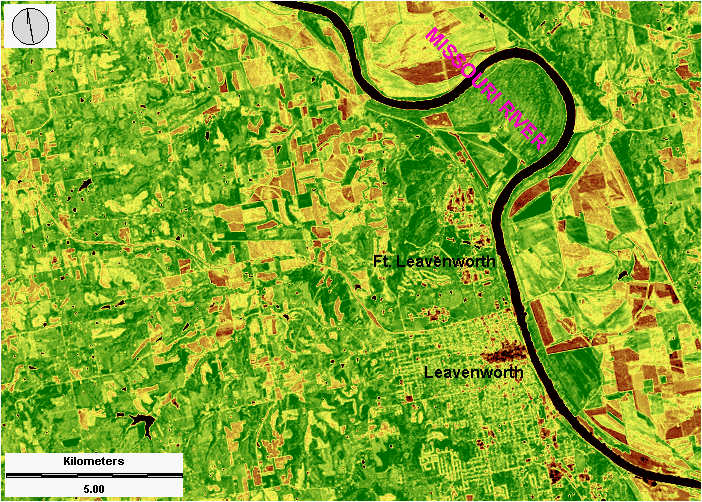
Normalized Difference Vegetation Index (NDVI)
The Normalized Difference Vegetation Index (NDVI) is a standardized index that allows to generate an image displaying greenness (relative biomass). This index takes advantage of the contrast of the characteristics of two bands, the chlorophyll pigment absorptions in the red band (R) and the high reflectivity of plant materials in the near-infrared (NIR) band.
This index is used for monitoring global vegetation because it compensates changes in illumination, surface slope, aspect, among other factors.
The NDVI process creates a single-band dataset that mainly represents greenery: NDVI = ((NIR - R)/(NIR + R)). The results obtained are values between -1.0 and 1.0, mostly representing greenness, where any negative values are mainly generated from clouds, water, and snow, and values near zero are mainly generated from rock and bare soil. Very low values (0.1 and below) of NDVI correspond to barren areas of rock, sand, or snow. Moderate values (0.2 to 0.3) represent shrub and grassland, while high values (0.6 to 0.8) indicate temperate and tropical rainforests.
Some of the most common uses for NDVI are: monitor drought, monitor and predict agricultural production, assist in predicting hazardous fire zones, among others.
http://resources.arcgis.com/en/help/main/10.2/index.html#//009t00000052000000
http://www.geospectra.net/lewis_cl/remote/lv-ndvi.jpg
Watershed and Fill tool
A watershed is the upslope area that contributes water flow to a common outlet as concentrated drainage. It can be part of a larger watershed and can also contain smaller watersheds, called sub-basins. Drainage divides are the boundaries between watersheds. The outlet, or pour point, is the point on the surface at which water flows out of an area. It is the lowest point along the boundary of a watershed.
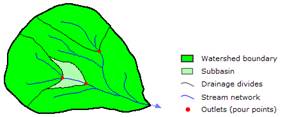 |
Watershed components |
Watersheds can be delineated from a DEM by computing the flow direction. But as we’ve seen before, DEMs can have errors. Sinks are often errors that occur due to the resolution of the data or rounding of elevations to the nearest integer value. They need to be filled to ensure proper delineation of basins and streams. If the sinks are not filled, a derived drainage network may be discontinuous. We use the Fill tool when we do hydrologic analysis to fill sinks. So, in ArcToolbox, select Spatial Analyst Tools --> Hydrology --> Fill.
http://resources.arcgis.com/en/help/main/10.2/index.html#//009z00000068000000
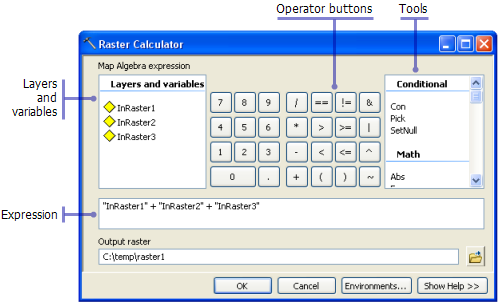
Raster Calculator
It’s a tool in the Spatial Analyst Tool designed to execute a single-line algebraic expression using multiple tools and operators using a simple, calculator-like tool interface. It allows creating and executing a Map Algebra expression giving a raster as an output.
http://resources.arcgis.com/en/help/main/10.1/index.html#//009z000000z8000000