Introduction
Location Map
GIS Concepts
Conventions
Database Schema
GIS Analysis
Flowchart
Custom GIS
Analyses
PHP Code
Base Map
Results: John
Martin SWA
Results: Lower
Gunnison
Conclusion
References
Analysis Results
We performed analysis on two separate areas, the John Martin State
Wildlife Area and the Lower Gunnison River between Grand Junction and
Delta.
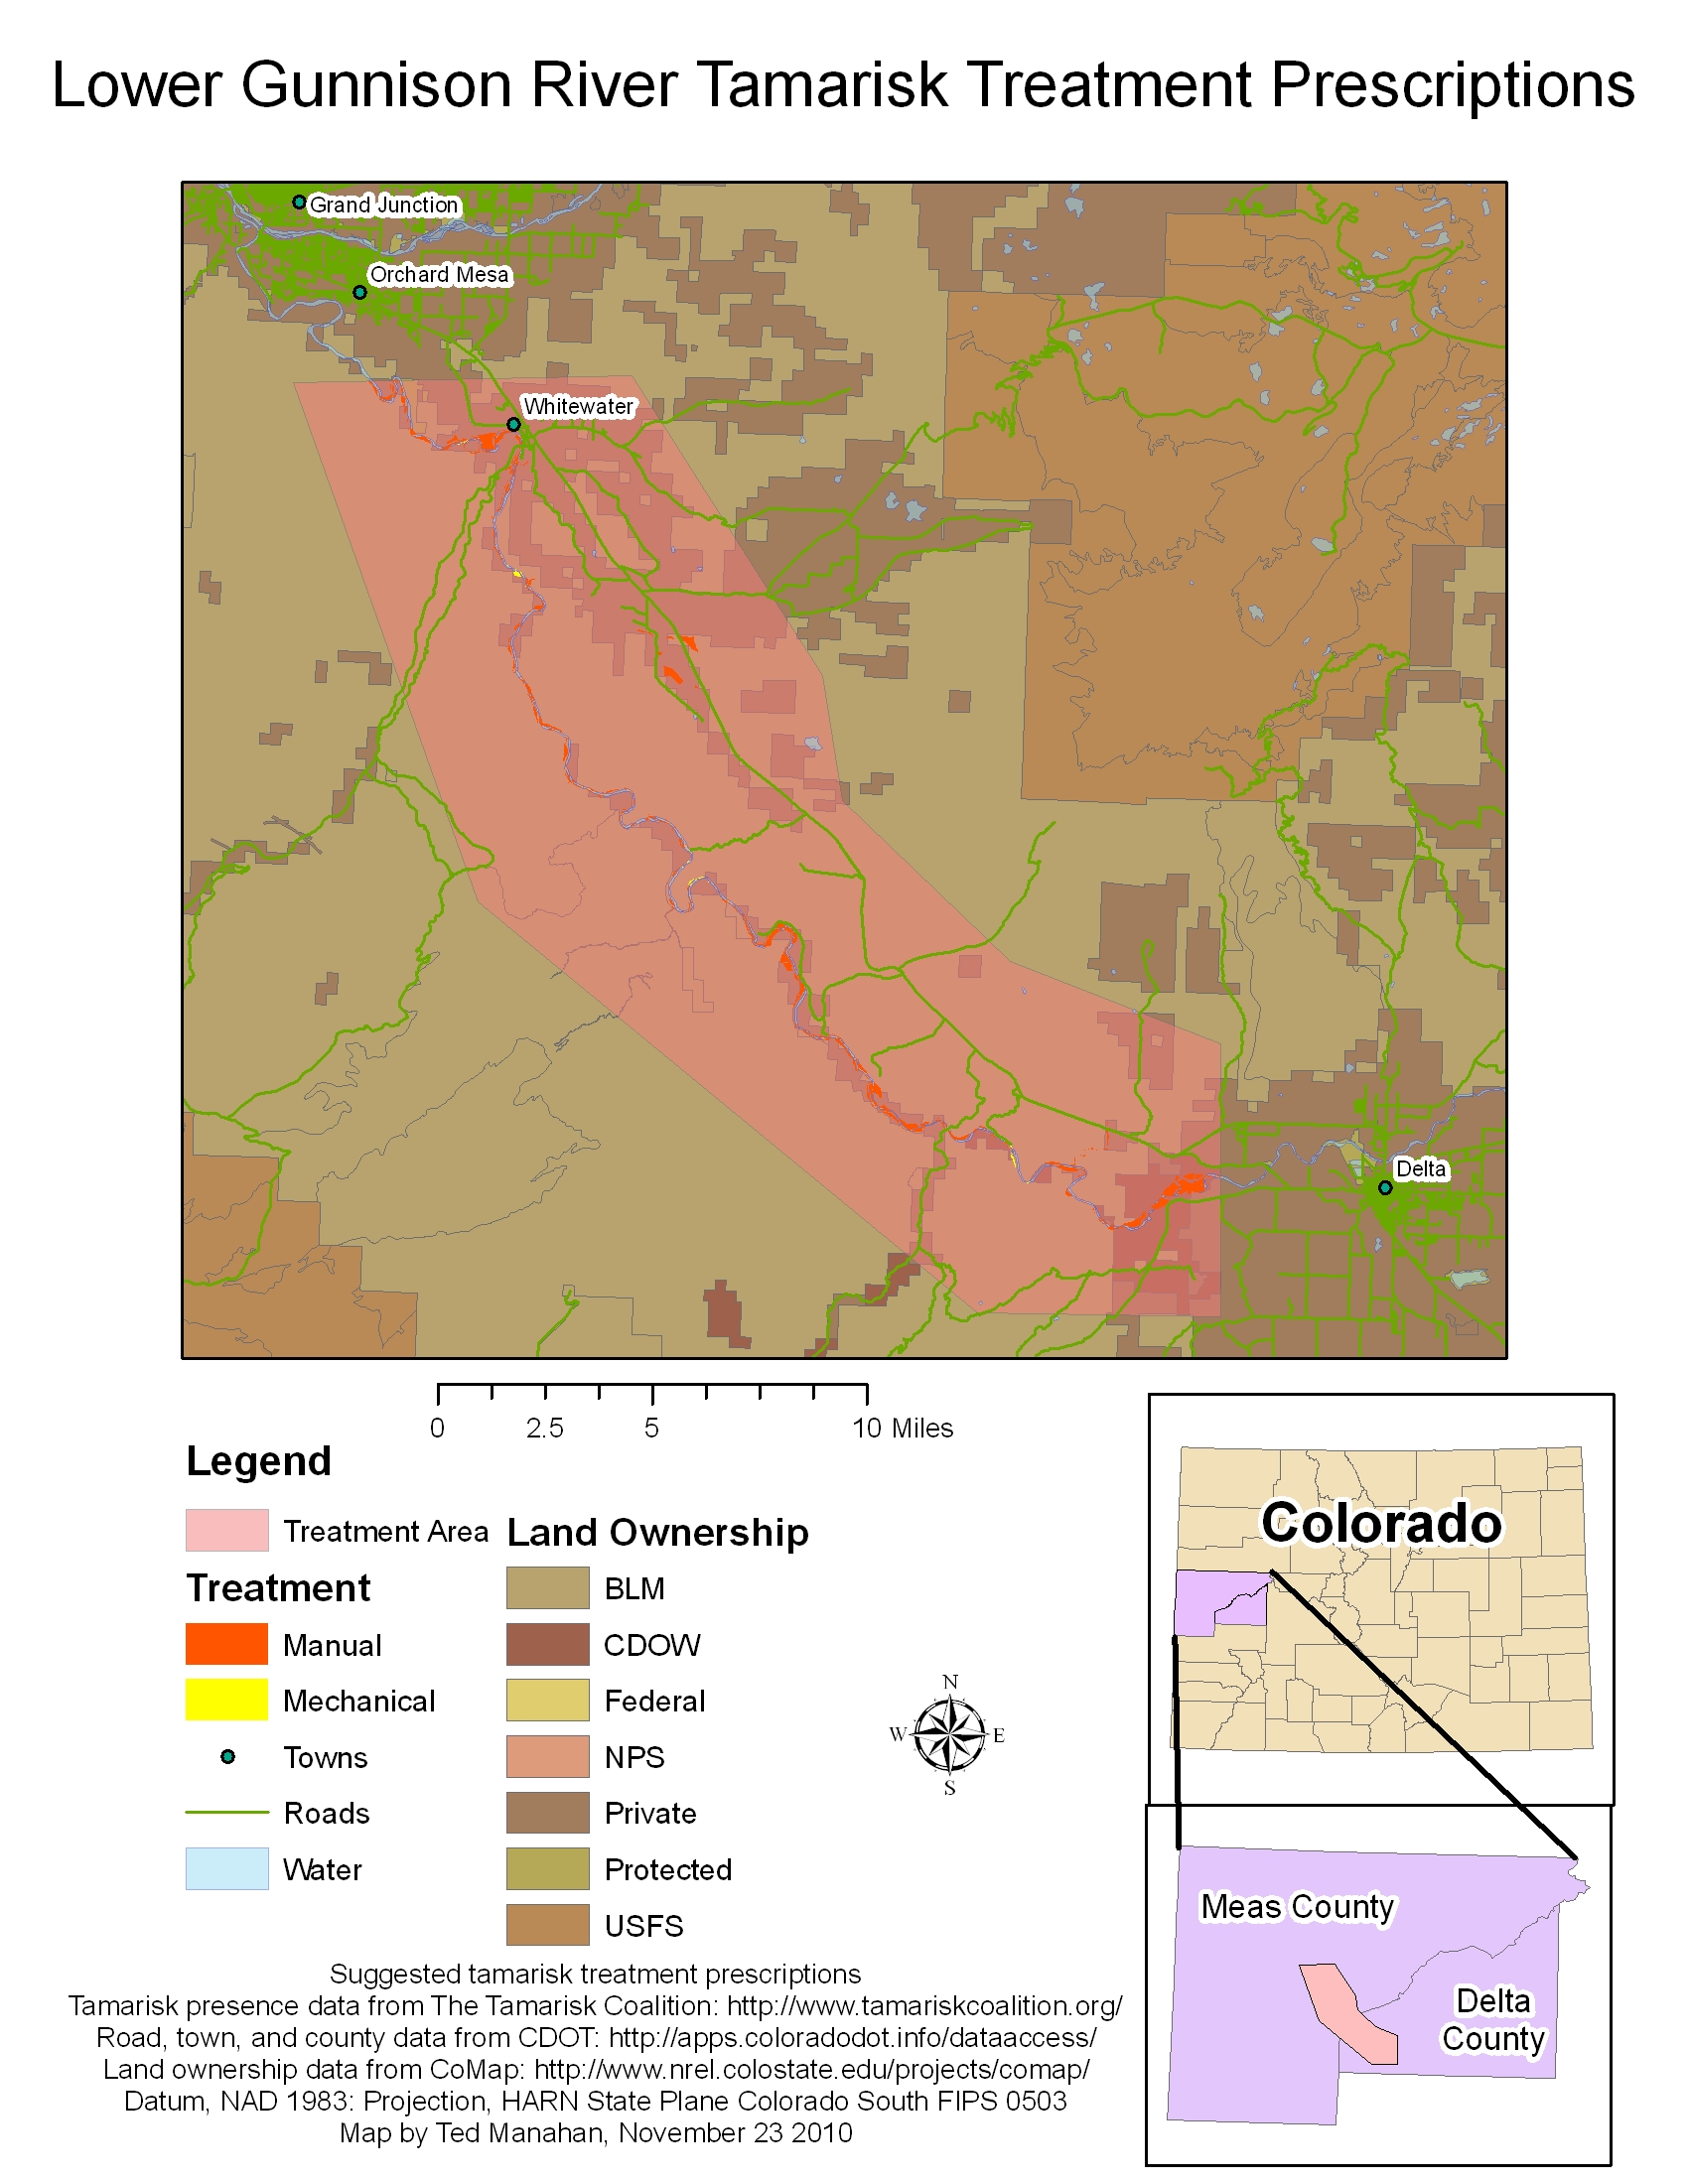
Lower Gunnison River
The lower Gunnison River between Grand Junction and Delta runs along
the eastern edge of Colorado's redrock canyon country. Compared to the
John Martin SWA study area, the lower Gunnison study area has a larger
number of tamarisk presence polygons, but the polygons are smaller.
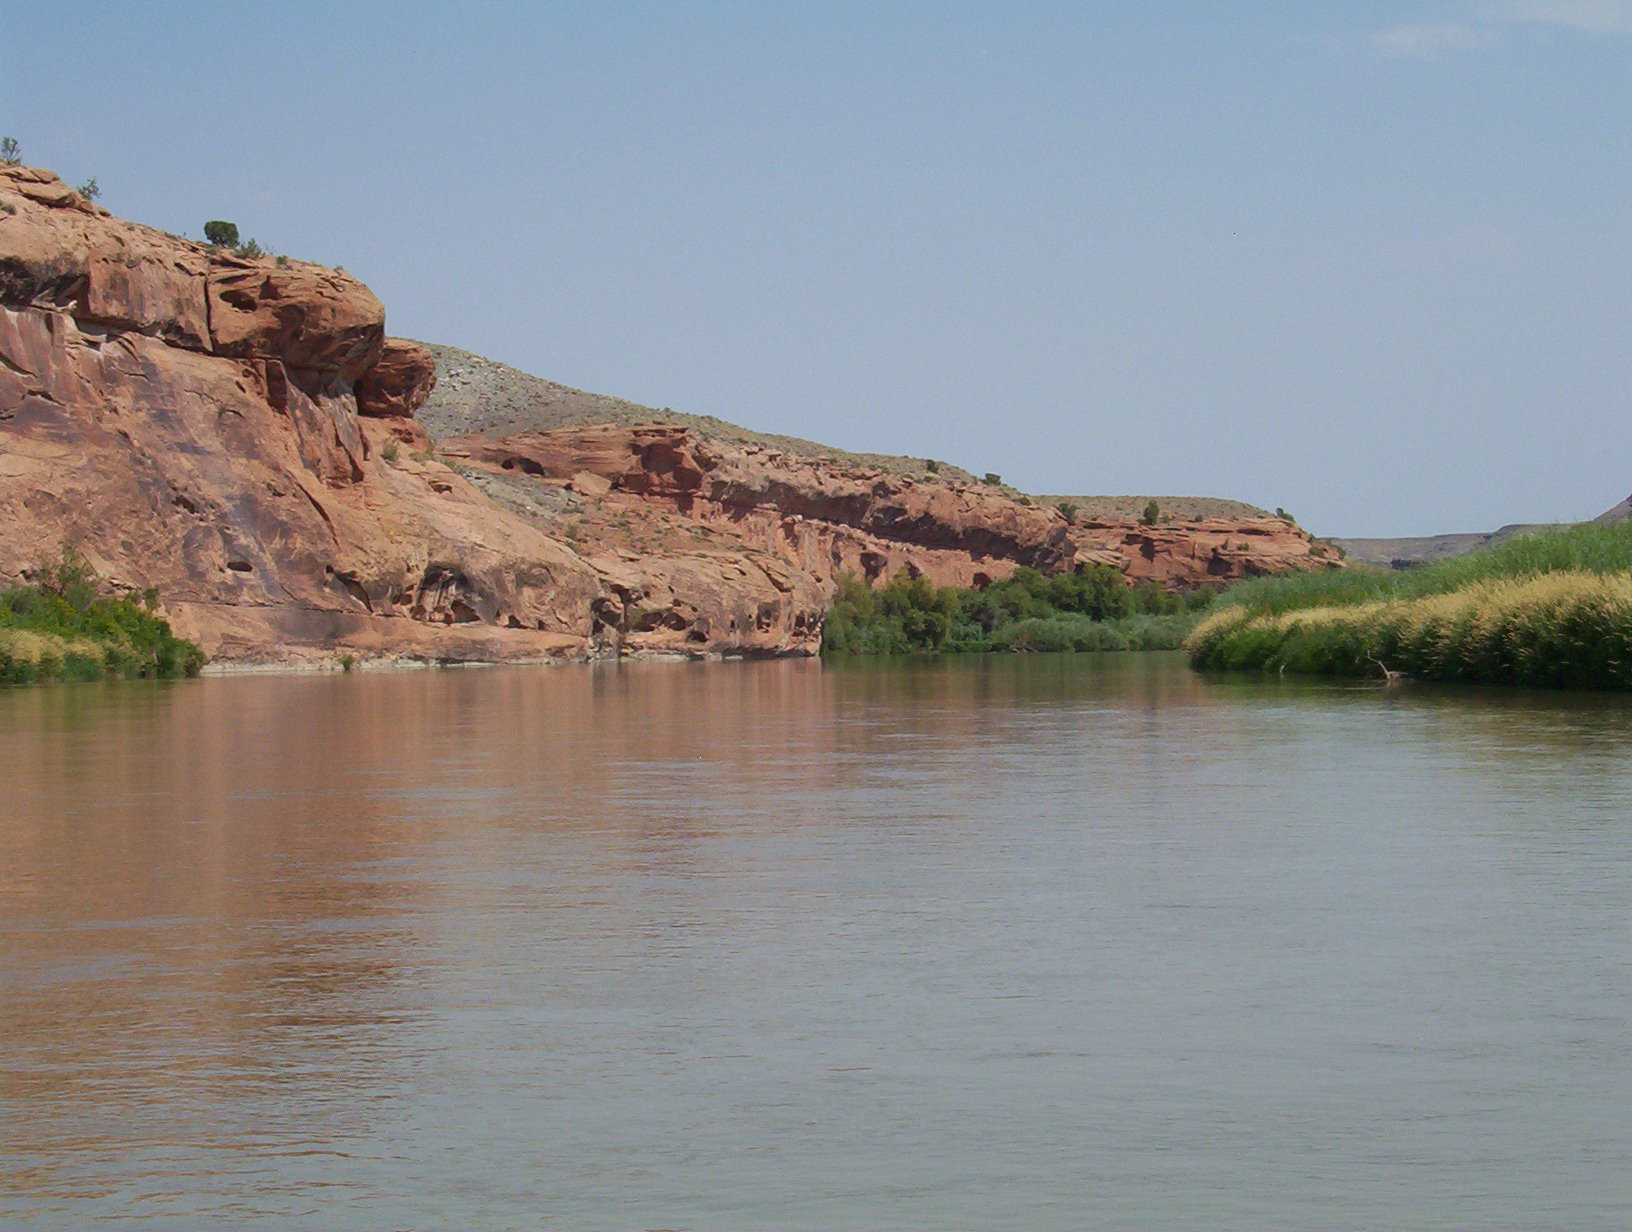
Much of the
tamarisk has low density, making Aerial treatment impractical. In
addition the area has much steeper terrain, making the adjusted
treatment cost significantly higher than the unadjusted treatment cost.Here is a photo of the area taken in the spring showing high water and some tamarisk along the river:
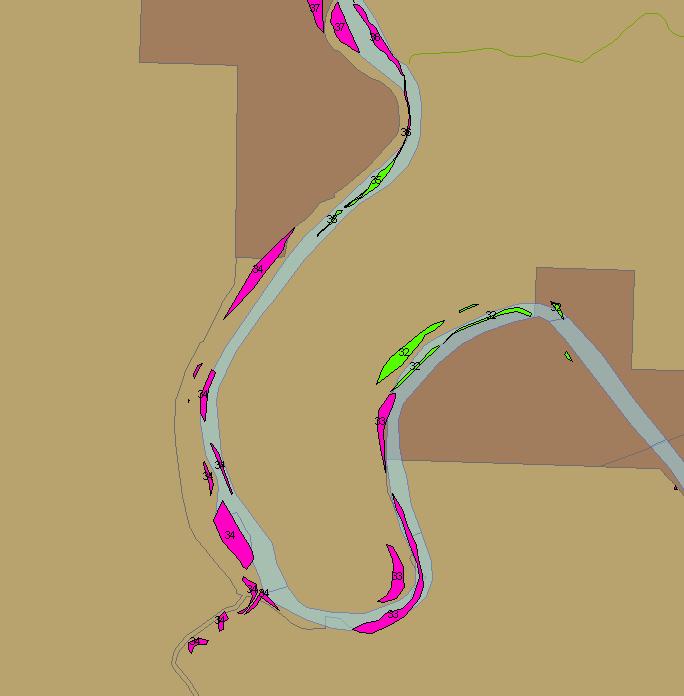
The final prescription map is shown below. A more detailed view of the map can be seen by clicking here.
The final proposed treatment groups are composed of these polygons:
Group 0: Mechanical: 8 32
Group 1: Mechanical: 9
Group 2: Mechanical: 35
Group 3: Mechanical: 56
Group 4: Mechanical: 68
Group 5: Manual: 0 1 2
Group 6: Manual: 3 4 6 60 7
Group 7: Manual: 5
Group 8: Manual: 10 11
Group 9: Manual: 12
Group 10: Manual: 13 14 15
Group 11: Manual: 16
Group 12: Manual: 17
Group 13: Manual: 18 19
Group 14: Manual: 20
Group 15: Manual: 21
Group 16: Manual: 22 23 24 26
Group 17: Manual: 25 27 28
Group 18: Manual: 29
Group 19: Manual: 30
Group 20: Manual: 31
Group 21: Manual: 33
Group 22: Manual: 34
Group 23: Manual: 36
Group 24: Manual: 37 38 40 49 50
Group 25: Manual: 39 43 44 45 54 46
Group 26: Manual: 42
Group 27: Manual: 47
Group 28: Manual: 48
Group 29: Manual: 51
Group 30: Manual: 52 53
Group 31: Manual: 55
Group 32: Manual: 57
Group 33: Manual: 58 62 63 64 65 71 69 70
Group 34: Manual: 59
Group 35: Manual: 61
Group 36: Manual: 66
Group 37: Manual: 67
Group 38: Manual: 72 73
Group 39: Manual: 74 76 77 78
Group 40: Manual: 75
Group 41: Manual: 79
The program used 7 trial groupings to find this solution.
The program calculates the total treatment cost by multiplying the treatment area for each polygon by the treatment cost for the selected treatment. The unajusted treatment cost is $4,456,273. Multiplying by the remoteness index for each polygon gives a scaled treatment cost of $64,002,145. Because of the relative inaccessibility of some of the tamarisk polygons, the adjusted treatment cost is significantly higher than the unadjusted treatment cost.
The area assigned to each treatment type is shown below:
| Treatment
Type |
Total Area |
| Aerial |
0 Acres |
| Mechanical |
29 Acres |
| Manual |
1466 Acres |
A detailed look at the center of the treatment area is shown below, with the polygon numbers included.