
Introduction
Location Map
GIS Concepts
Conventions
Database Schema
GIS Analysis Flowchart
Custom GIS Analyses
PHP Code
Base Map
Results: John Martin SWA
Results: Lower Gunnison
Conclusion
References
Group Project Website Template
Project analysis required the following data layers.
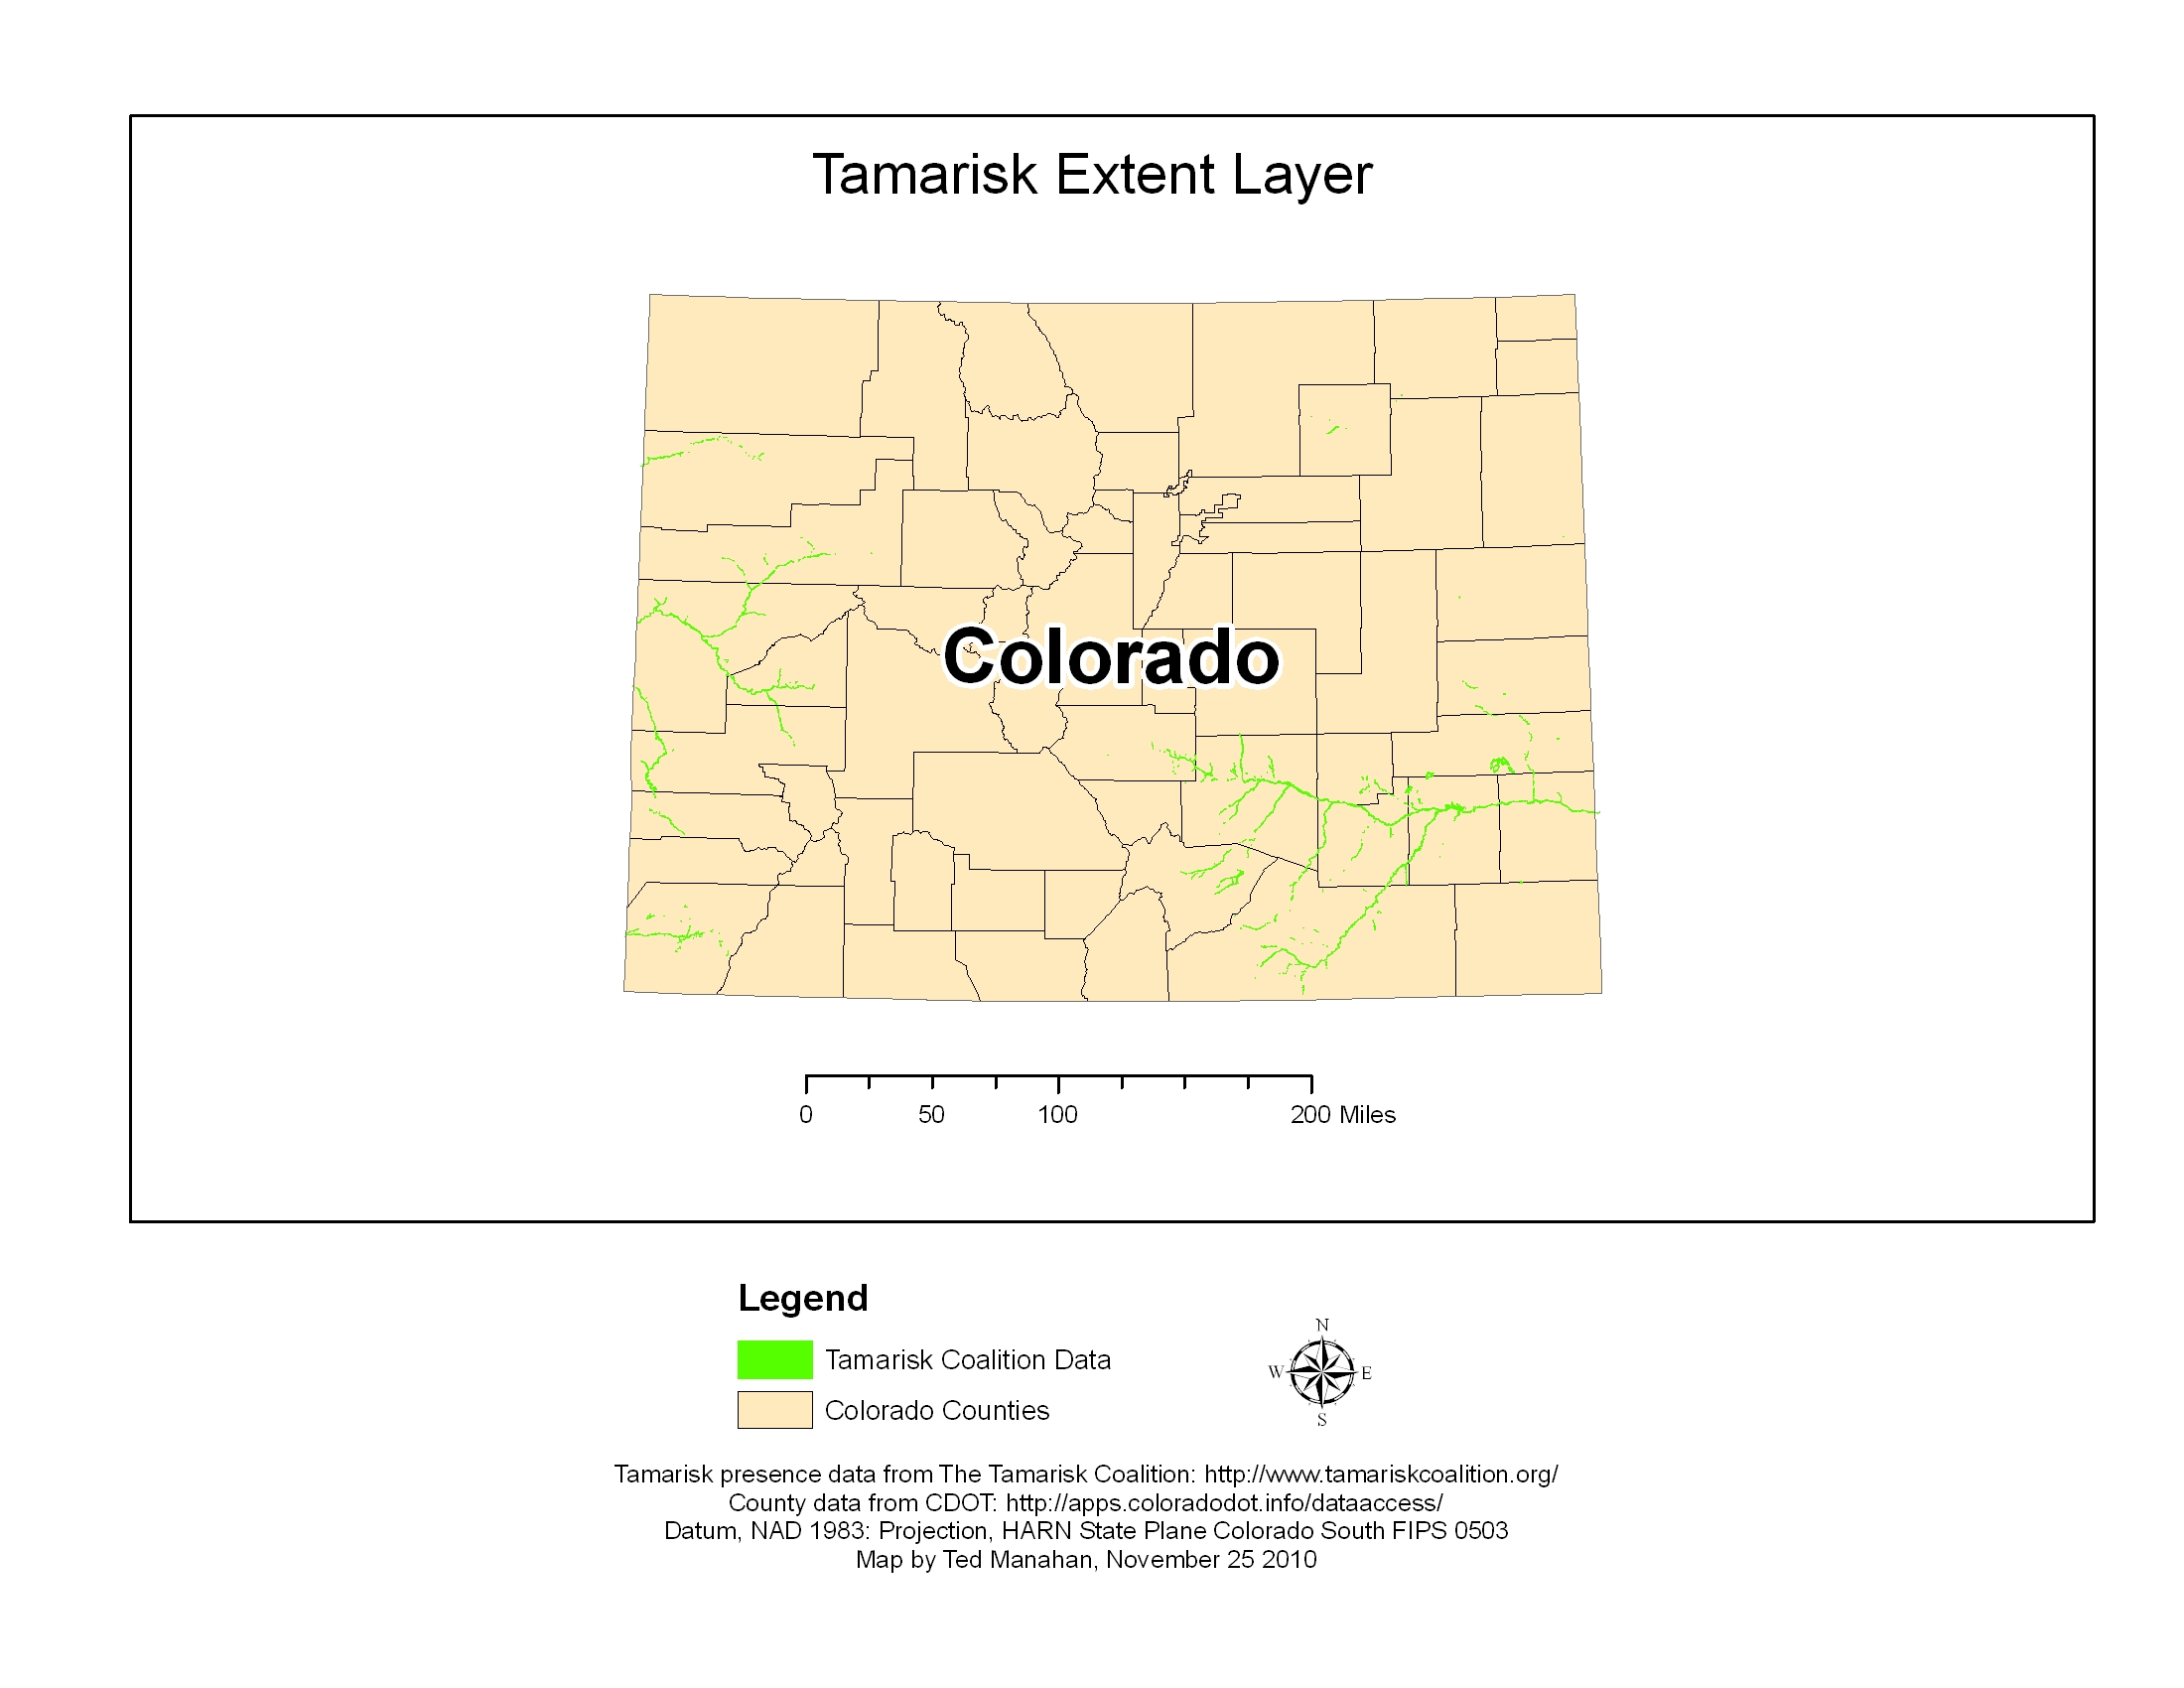
Existing Tamarisk Inventories
In 2008, The Tamarisk Coalition (http://www.tamariskcoalition.org)
released the Colorado Tamarisk
Mapping and Inventory Report (Tamarisk Coalition 2008). This report includes tamarisk
extent information for the entire state. This data layer was used to
describe the location, extent, and other attributes of tamarisk
infestations. There are a total of 1633 festures in this data set, many
of which are composed of multiple polygons. Specific attributes of this
data used when assigning treatment prescriptions can be found in the Custom GIS Analysis page of this website.
You can see a more detailed version of this map by clicking here.
Terrain Maps and Road Maps
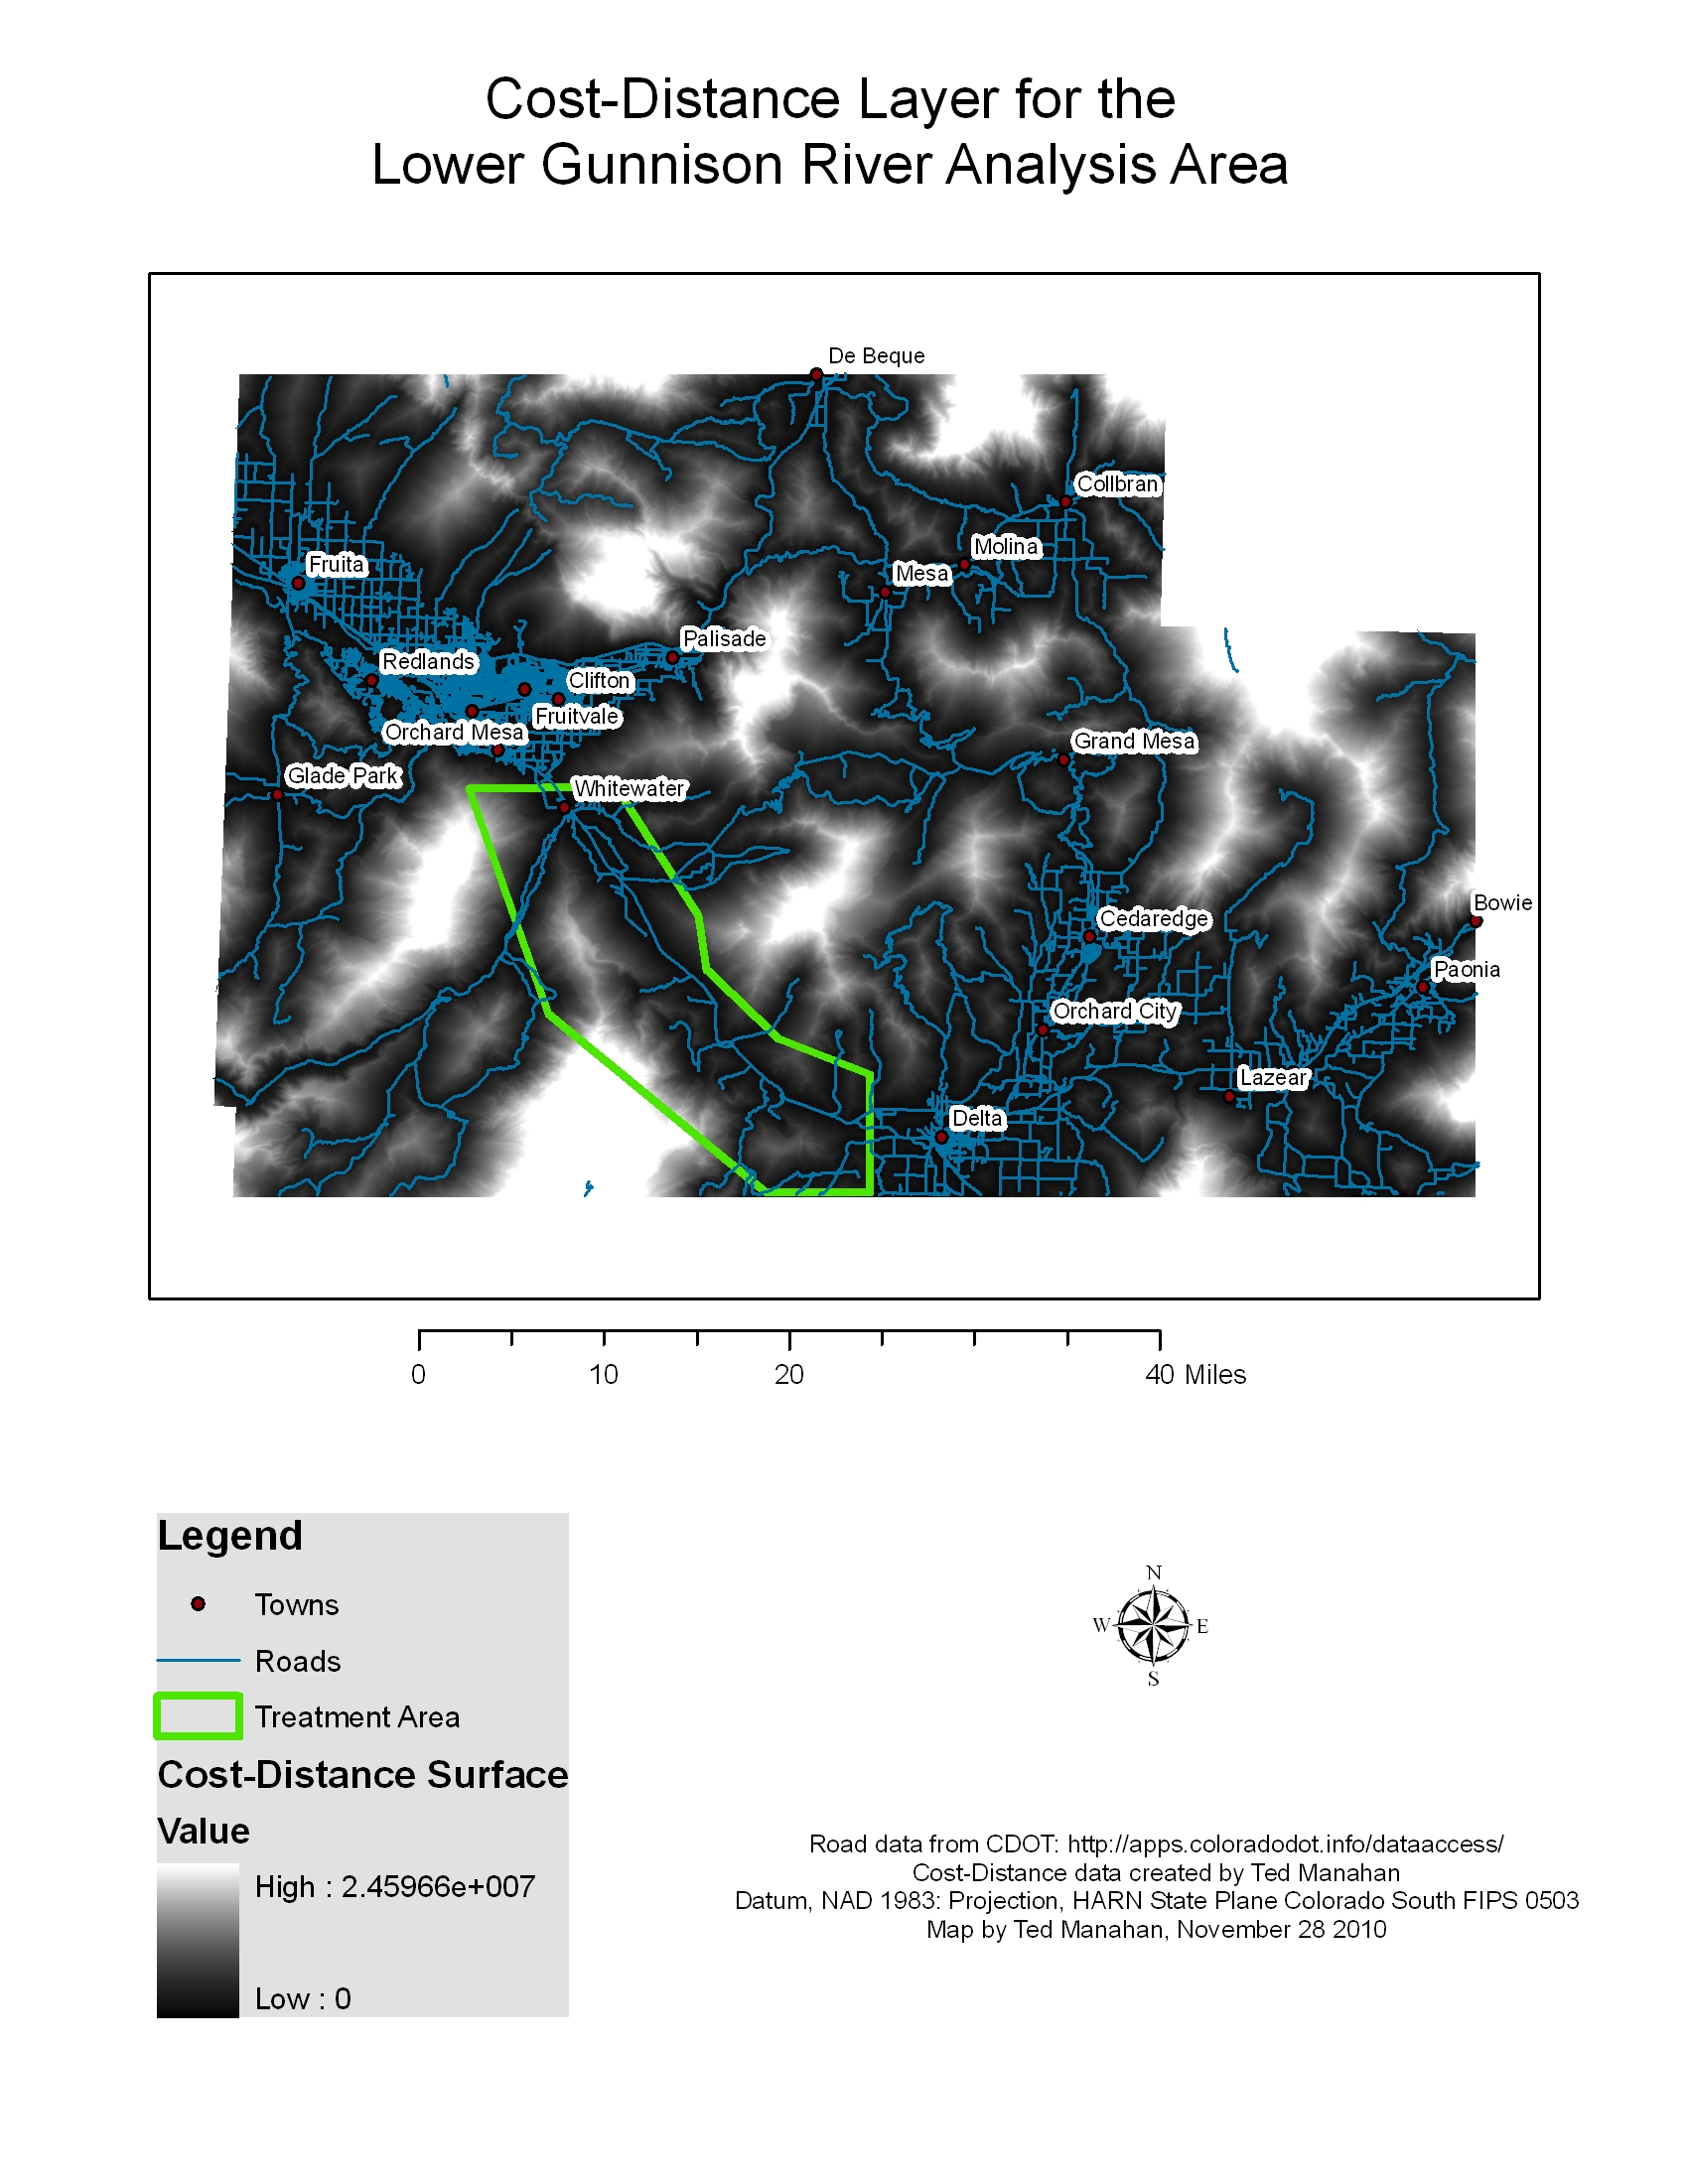
A slope layer of each study area is used to calculate remoteness. This is based on DEM data from the National Map. A road map is used to create a layer with the cost of road travel based on speed limit. Road data is from the Colorado Department of Transportation. These data layers are combined to create a cost distance raster. On the final cost-distance layer it is easy to see how locations near roads have a lower cost-distance value than areas far from roads.
Here is the cost-distance layer for the John martin Wildlife Refuge study area. Click here to see a larger
version of the map.

Here is the cost-distance layer for the lower Gunnison River study area. Click here to see a larger version of the map.
Land Use Maps
Land uses such as wilderness designation could limit treatment
options.
For this analysis land use maps used were used only for display
purposes, and to delineate the John Martin SWA. Land use data wasfrom
Colorado Ownership
Management and Protection project (COMap:
http://www.nrel.colostate.edu/projects/comap).