
Introduction
Location Map
Base Map
Database Schema
Conventions
GIS Analyses
Flowchart
GIS Concepts
Results
Conclusion
References
![]()
Introduction
Background
This study aims to provide an alternative method for mapping political subdivisions at an archaeological site in the highlands of Michoacan, Mexico. The archaeological site of Angamuco is a large urban center that was occupied during the Classic to Postclassic periods in Mesoamerican chronology (~ 200 – 1520 AD). It was built by an indigenous culture known as the P'urépecha, also known as the Tarascans. This culture built a large state in western-central Mexico that was contemporary with the better known Aztec Empire.
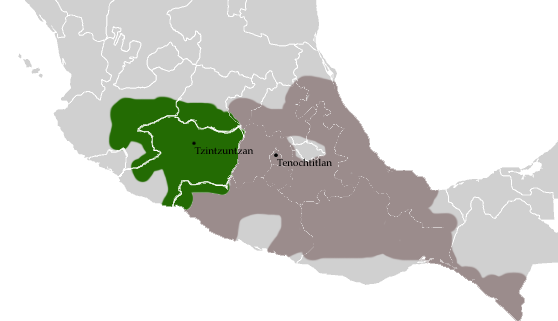
The Relative size of the P'urepecha (or Tarascan) empire (in Green) and the Aztec empire (dark grey).
This image was uploaded to wikipedia by Maunus on 20 Sept. 2010. The author has released this image to the public domain.
Like their neighbors in Central Mexico, the ancient P'urépecha built large urban centers. Angamuco is situated on a series of Late Cenozoic a'a lava flows covered in temperate deciduous forest (Fisher and Leisz 2013). It is estimated that there are 20,000 architectural elements visible from the surface of the site. The architecture which is visible today is constructed from basalt quarried from the lava flow, and includes pyramids/temples, palaces, plazas, residential structures, terraces, road systems, and ball courts.
Mesoamerican cities have a high degree of cross-cultural diversity in urban layout, but in general tend to follow a pattern of nested hierarchical subdivisions (Arnauld et al 2012). Political organization beneath the level of the city government was organized around neighborhood-level units of varying degrees of scale. In many Mesoamerican cultures, these neighborhoods were spatially bounded territorial units that fulfilled both political and economic functions (Lockhart 1992).
At Angamuco, three levels of territorial divisions have been identified. The largest level is the district, which is followed by neighborhoods at the intermediate scale, and complejos at the smallest scale. While neighborhoods and districts likely represent formal territorial units with distinct political boundaries, complejos are more informal units composed of groupings of individual structures, and might be considered roughly analogous to a modern city block.
Roughly 40% of the site was covered through traditional archaeological survey over the course of three years (Fisher and Leisz 2013). However, due to the size of the site and the thickness of vegetation on the surface, the project team opted for an alternative mapping technique. A nine square kilometer section of the site was mapped through the use of LiDAR (Fisher and Leisz 2013, Chase et al 2012). Unlike older methods of mapping, LiDAR allows researchers to take millions of points on a landscape with sub-meter accuracy. Each point contains x, y, and z location data. Most of these points record the tree canopy, but due to the sheer quanitity of points, some of them will happen to penetrate the leaves and reflect off of the surface of the ground. The points located in the forest canopy were removed (see embedded video below) allowing us to examine the surface of the ground below the canopy. This was then used to generate a Digital Elevation Model with a resolution of 25cm per pixel.
An animation of LiDAR at a yacata (keyhole-shaped temple) at Angamuco, showing the tree canopy and underlying architecture. From the LORE: LPB website.
The use of LiDAR is relatively new to archaeology (Chase et al. 2012). Unlike related fields such as ecology, there are not many tools available to archaeologists for analyzing remotely sensed data. There is little to no published literature that archaeologists can draw on in developing research methods. As a result, the methods presented here are entirely experimental, and all results must be considered preliminary.
Purpose and Methods
This study aims to test the effectiveness of two methods for mapping complejos at the archaeological site of Angamuco. Although complejos are clearly visible at the site, identifying the boundaries of individual complejos in the LiDAR generated DEM is difficult. Of the 684 complejos that have been tentatively identified, only 167 have been ground truthed through traditional archaeological survey. The remaining 517 complejos were digitized manually by an observer working in ArcGIS using a composite (or 'multi-look') hillshade of the site overlaid on the digital elevation model.
Human Control Group
To test the reliability of this method, we used a control group of eleven individuals to draw boundaries around nine complejos selected from the original sample of 684 by a random number generator. A centroid was taken from each of the selected complejos and represented as a point feature in ArcMap. These points were overlaid above a multi-look hillshade and digital elevation model of the site. Thirteen example complejos from the orignal map were shown as polygons to use as comparisons. Participants were asked to draw polygons around the point based on where they perceived the boundary of the complejo to be. Each participant was given a brief tutorial and asked to evaluate complejo boundaries based on the following criteria:
- Roads are considered boundaries of complejos, regardless of size
- Major topographic changes mark complejo boundaries.
- Often multiple complejos are arranged around plazas, defined as bounded, flat areas. In these instances, the plaza should be considered a boundary.
- Occasionally complejos are enclosed by stone walls. In these instances, the walls should be considered boundaries.
eCogniton's Multiresolution Segmentation (MRS)
We then compared the effectiveness of this method of mapping with a second method: Multiresolution Segmentation (MRS), an algorithm in eCognition used to segment raster images into discrete units based on specified parameters. Although this method has not been used in any archaeological application to date, its use has been well established in other fields for analysis of remote sensing data (Baatz and Shäpe 2000). This algorithm will segment a raster image based on three parameters: color, compactness, and scale. The color parameter defines the importance that the algorithm will assign to color, as opposed to shape. It can be set anywhere from 0.9 (at which point color will be the primary determinant of the segment) to 0.1 (at which point shape will be the primary determinant). Compactness determines how 'round' the segments will be. A low compactness value will yield irregular, elongated segments, while a high compactness value will yield more regular, rounded segments. The scale parameter is largely arbitrary and determines the relative size of the segments.
Over one hundred iterations of this algorithm were run on four different image rasters generated from the DEM. For the purposes of the study, the compactness parameter was held constant at 0.5. The color parameter was varied between 0.1 and 0.2, and the scale parameter was varied between 250 and 500. Beyond these values, the algorithm was deemed ineffective. Refer to the section on GIS analysis for additional information on the process used.
Both the human control group and the eCognition MRS outputs were then compared to the original complejo map to determine the degree to which they corresponded with the hypothetical complejo boundaries. The results of the analysis are discussed in the remaining sections.