Introduction
Location Map
Base Map
Database Schema
Conventions
GIS Analyses
Flowchart
GIS Concepts
Results
Conclusion
References
![]()
Introduction
Interpolation Surface Comparison
Basis of project:
ArcGIS has several tools that are capable of transforming x,y,z point data into a 3D surface. Because of our need for further analyses on these surfaces, we needed to determine which interpolation process would best represent our data. We have both small (300-400) and large (over 37,000) datasets, which should behave differently in the various ArcGIS tools.
Interpolation
Interpolation in a GIS is the estimation of surface values at un-sampled points based on known surface values of surrounding points. Interpolation is common when using point files to estimate elevation, rainfall, temperature, etc. to create surfaces in ArcGIS.In the following analyses, we use both our "small" and "large" data files to create 3D surfaces using various tools in ArcMap. The tools/processes that we found to be most successful were: Inverse Distance Weighting (IDW), Kriging, Natural Neighbor, and Triangulated Irregular Network (TIN).
Study Sites
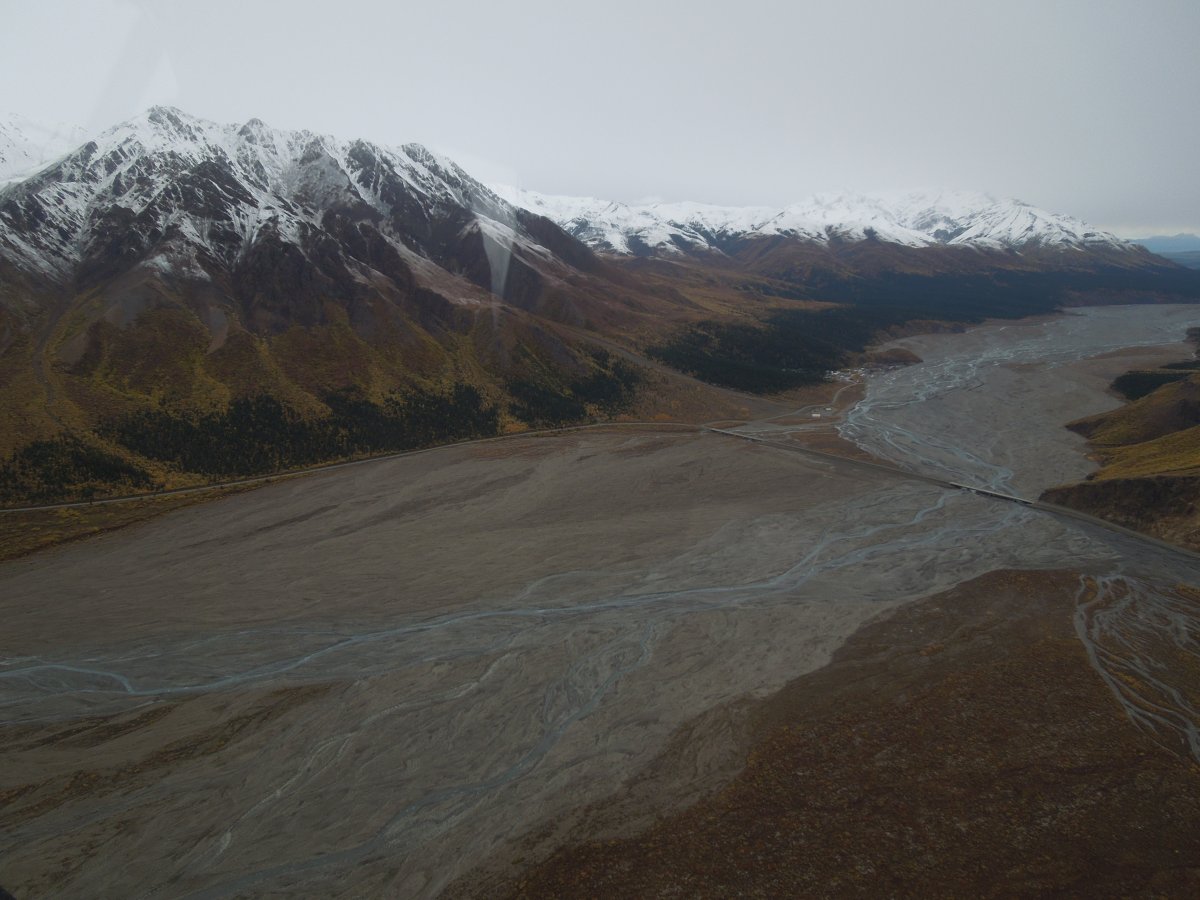
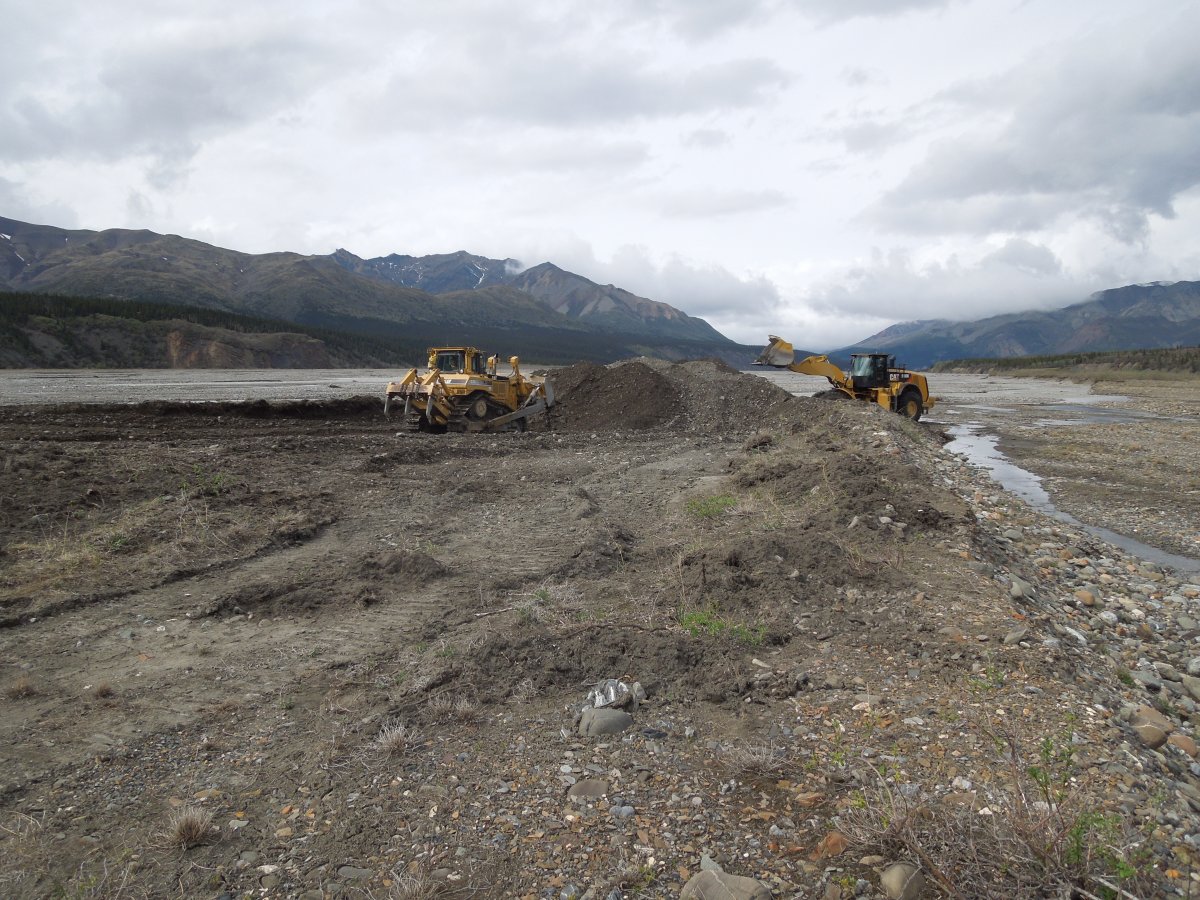
The Toklat River:
Our small dataset was derived from elevation data along a small segment of the Toklat River, AK. This data is a component of a project that will analyze sediment transfer dynamics and the implications of NPS in-stream gravel mining along a reach of the Toklat River, AK. The river initiates in Denali National Park and Preserve in a glaciated drainage basin. The park has constructed bridges across the Toklat River in the same area where the park extracts sediment to refurbish the 90 mile long park road. The National Park Service has determined that extraction of sediment from a renewable, glaciated river is a lesser impact than trucking in thousands of tons of gravel along this 90-mile stretch of road. To continue this practice, the park has invested in research of sediment transfer, river dynamics and infrastructure impacts along this stretch of the Toklat River. The data used in this GIS Analysis were obtained from a Real Time Kinematic differential GPS.
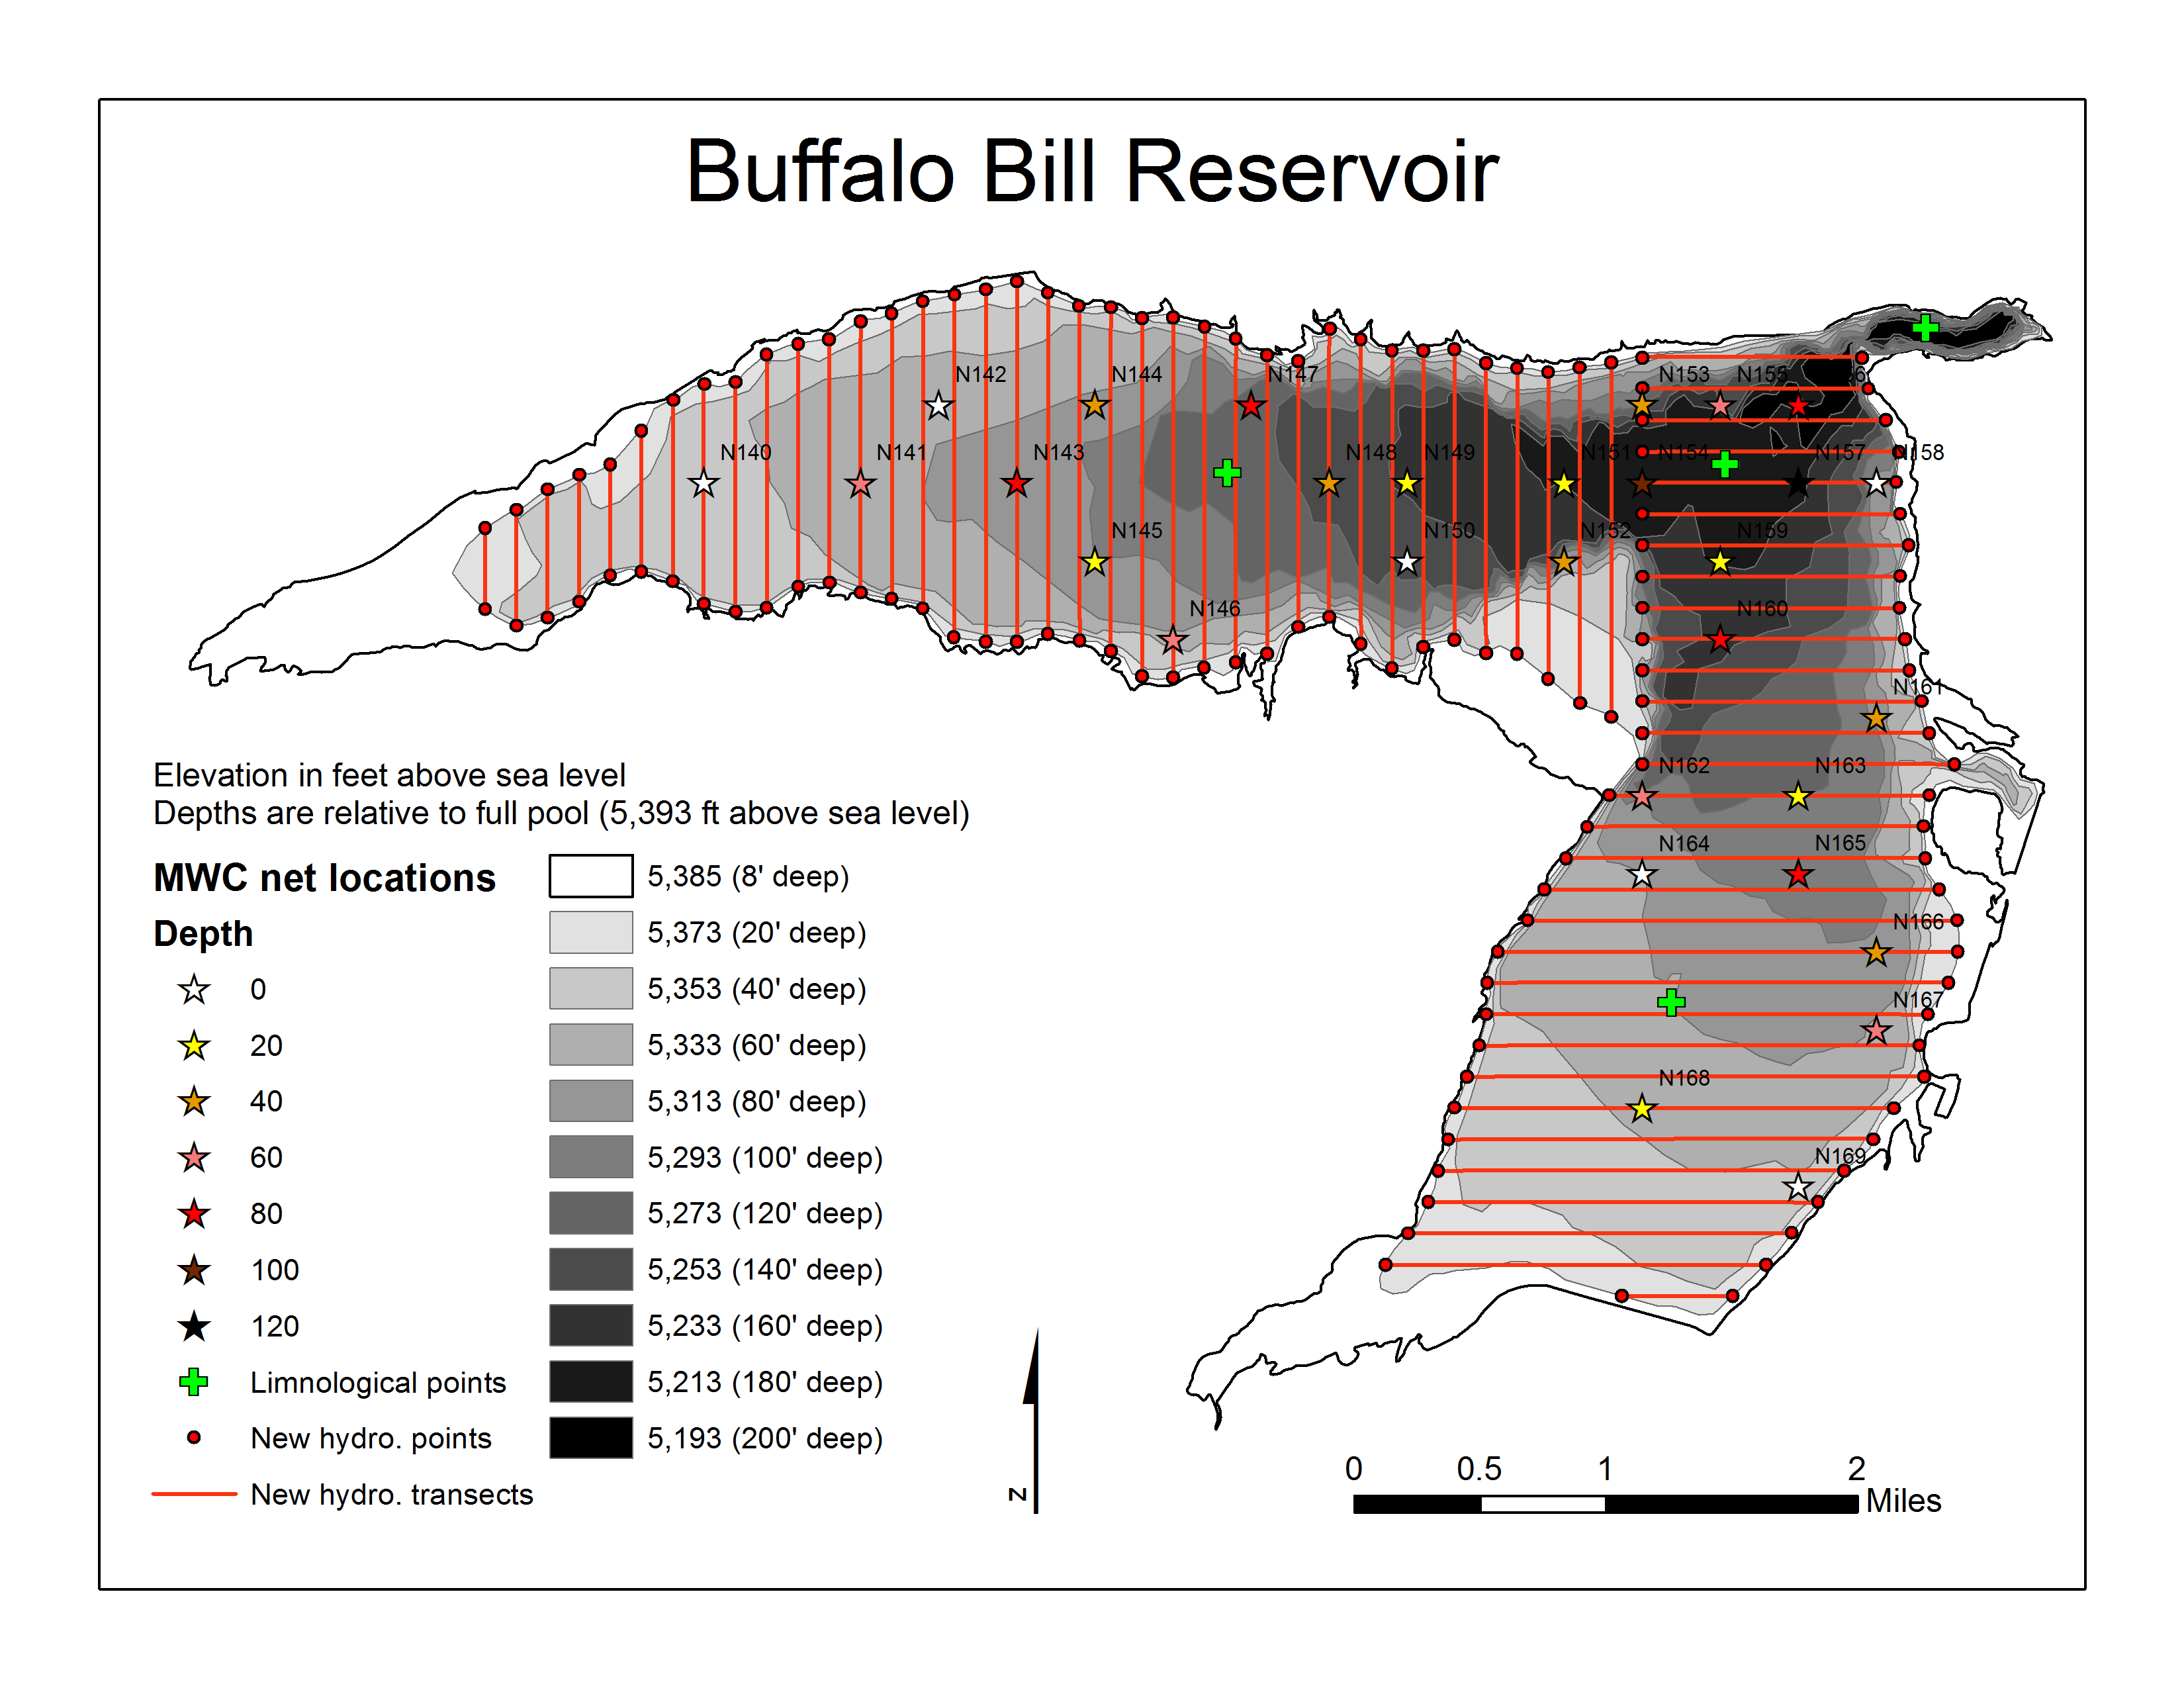
Buffalo Bill Reservoir:
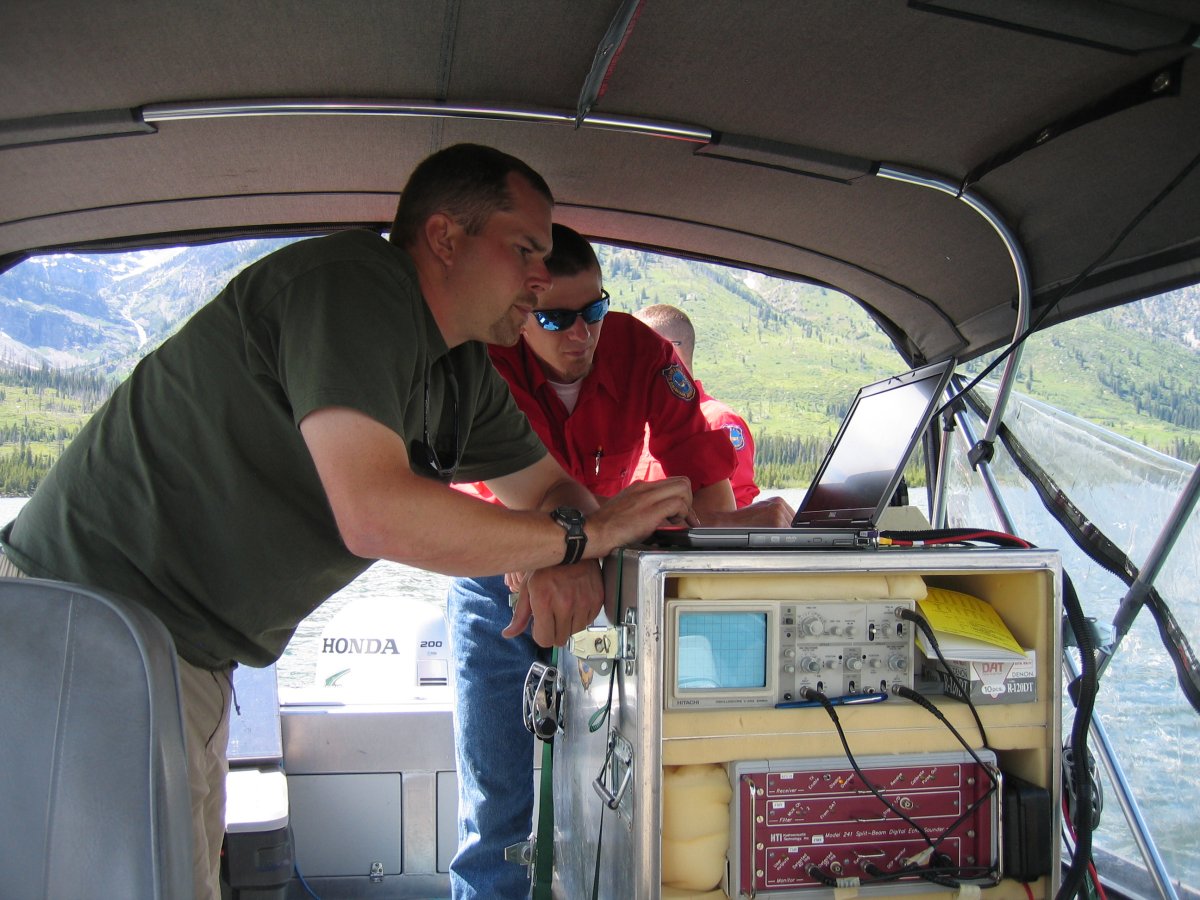
Our large dataset was derived from data that were collected both from over 150km of sonar transects, and digitizing Landsat8 images during different reservoir elevations. The sonar transects were conducted by Travis Neebling of the Wyoming Game and Fish Department's Aquatic Assessment Crew. The resulting bathymetric map will be used for estimated fish abundance from calculated water volumes. These estimates will be critical for a food web and bioenergetics study that is taking place on Buffalo Bill Reservoir.