Introduction
Location Map
Base Map
Database Schema
Conventions
GIS Analyses
Flowchart
GIS Concepts
Results
Conclusion
References
![]()
Conclusion
Conclusion
Because of the many processes/tools that can be used in ArcGIS to create a surface from x,y,z points, we sought to determine which one would work best for our data. We found that all methods produced a visually useful surface that we could have used for further analyses, but we took steps to determine what process fit our data best. We note that this level of surface comparison may not be warranted for every type of spatial analysis.
Small Dataset Conclusions:
The capability of TIN surfaces to accurately capture elevation values for input data points exceeds those interpolated through Natural Neighbor. In this analysis, the Extract Values to Points tool was quantitatively the most satisfactory comparison tool. However it is likely there are other forms of comparison where the benefits of a Natural Neighbor technique would exceed the capabilities of a TIN surface. To further quantify the change in elevation between these two time periods and future ones, further analysis is required. Ideally, more points will be available in your dataset to allow a wider range of surface interpolation techniques.
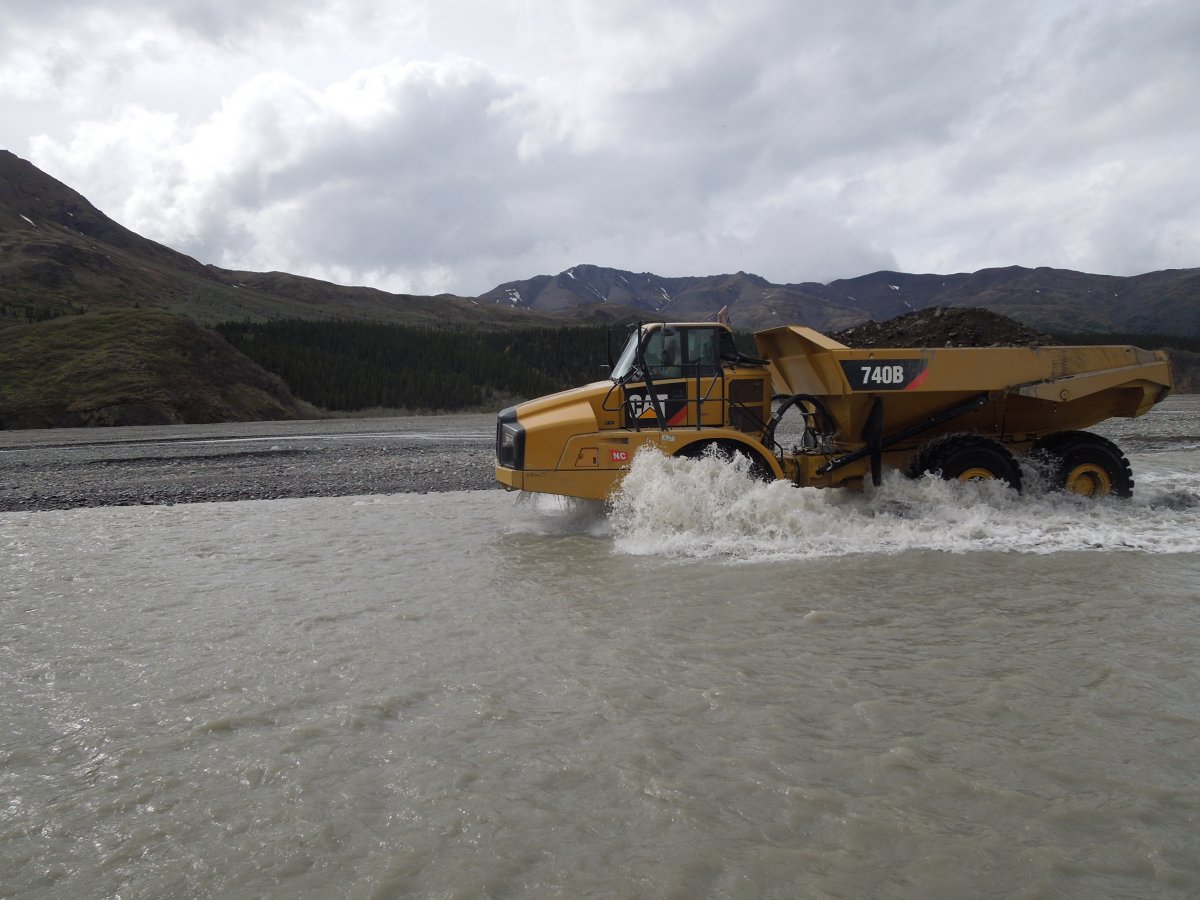
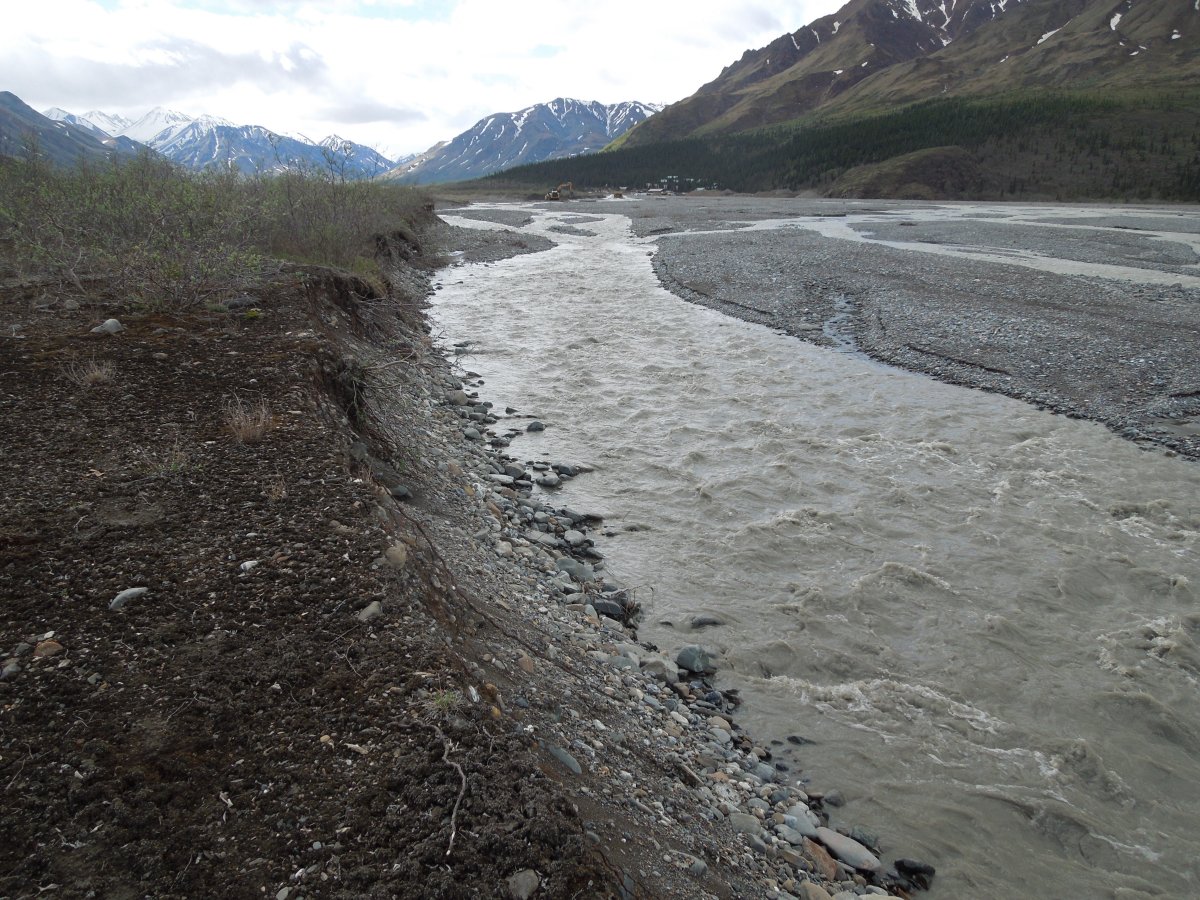
The implications this surface comparison has for this study site is complex. These data came from a location where almost 22,000 cubic yards of gravel were recently extracted. However both forms of analysis show a clear increase in overall elevation within this area of floodplain. The impacts of gravel mining are not clearly understood and an analysis such as this adds further complexity to this system. If depositional processes can occur in an area of recent extraction, where are the effects of this practice materializing and what do they look like?
Large Dataset Conclusions:
Large datasets can be overwhelming. When a dataset has thousands of lines of values (over 37,000 in our case) errors can be easily overlooked or missed. A thorough check for missing values or outlying points is an important step before conducting any type of analyses or surface constructions in R.
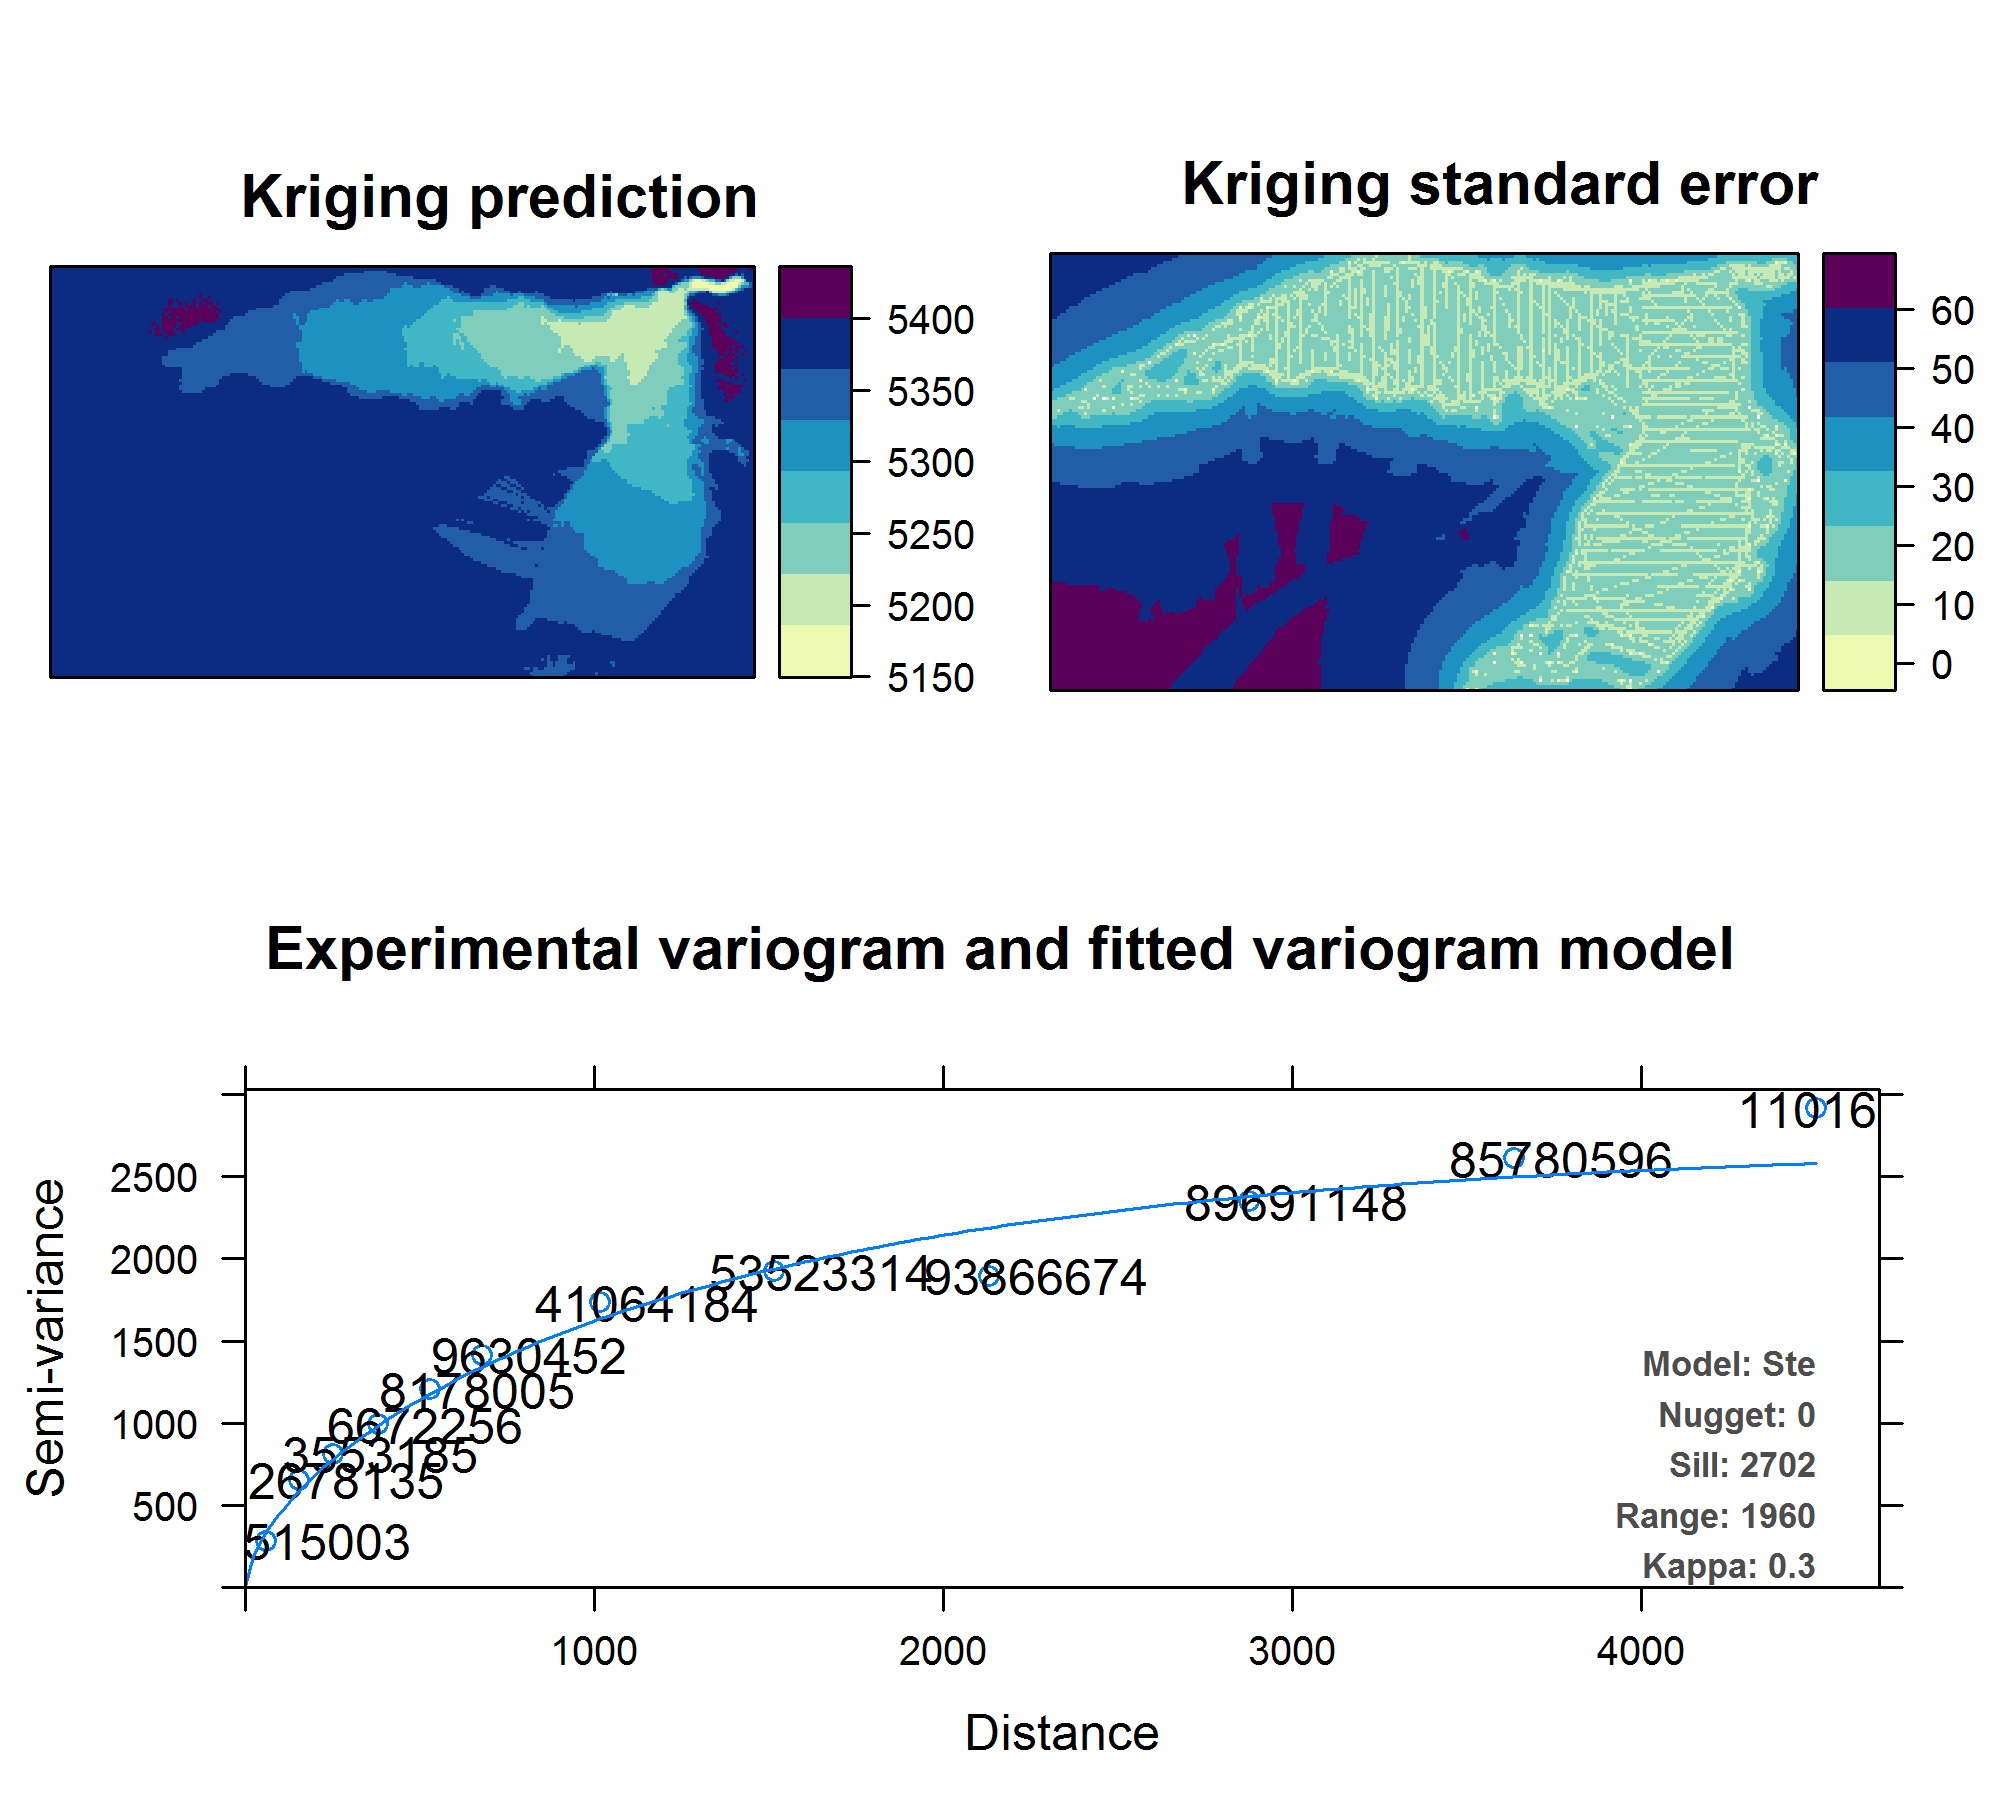
Kriging
Determining the best Kriging method can be cumbersome. If anything beyond a visual representation is needed, I would suggest either using the ArcGIS Geostatistical Analyst Wizard or a non ArcGIS program to test model fit before making a surface in ArcGIS. The autoKrige function in the R package was found to be a great process for testing kriging models (see below). R considers up to 20 different variograms when fitting models to data, and maps can be constructed inside the program as well.
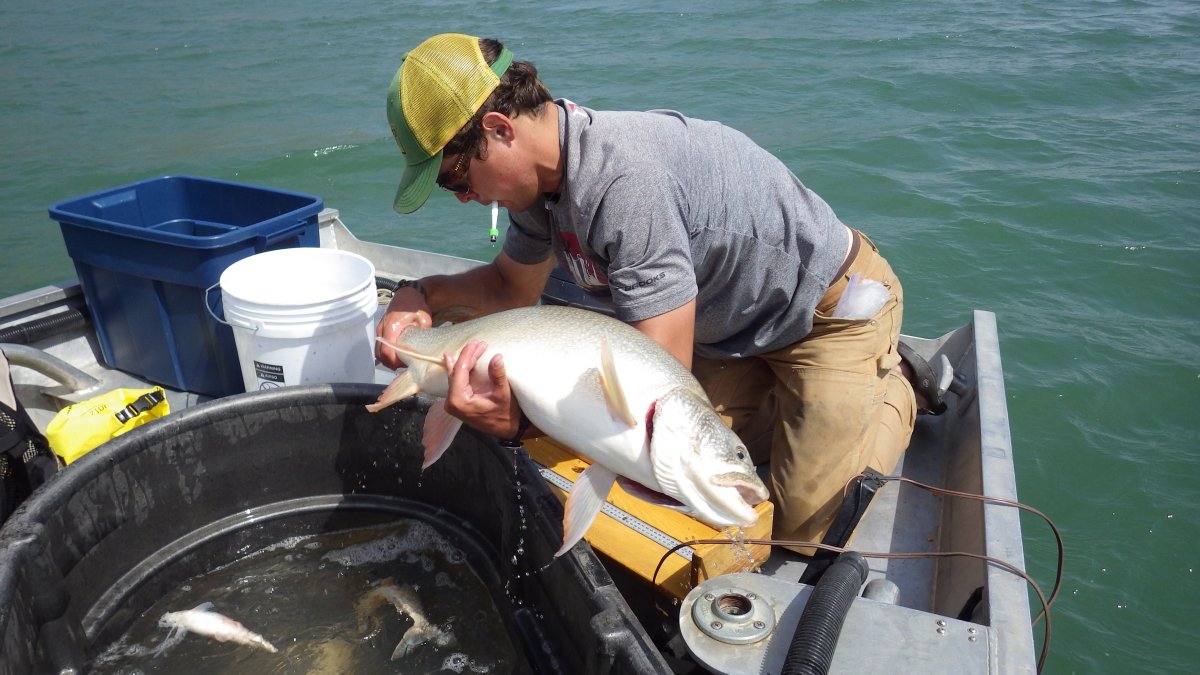
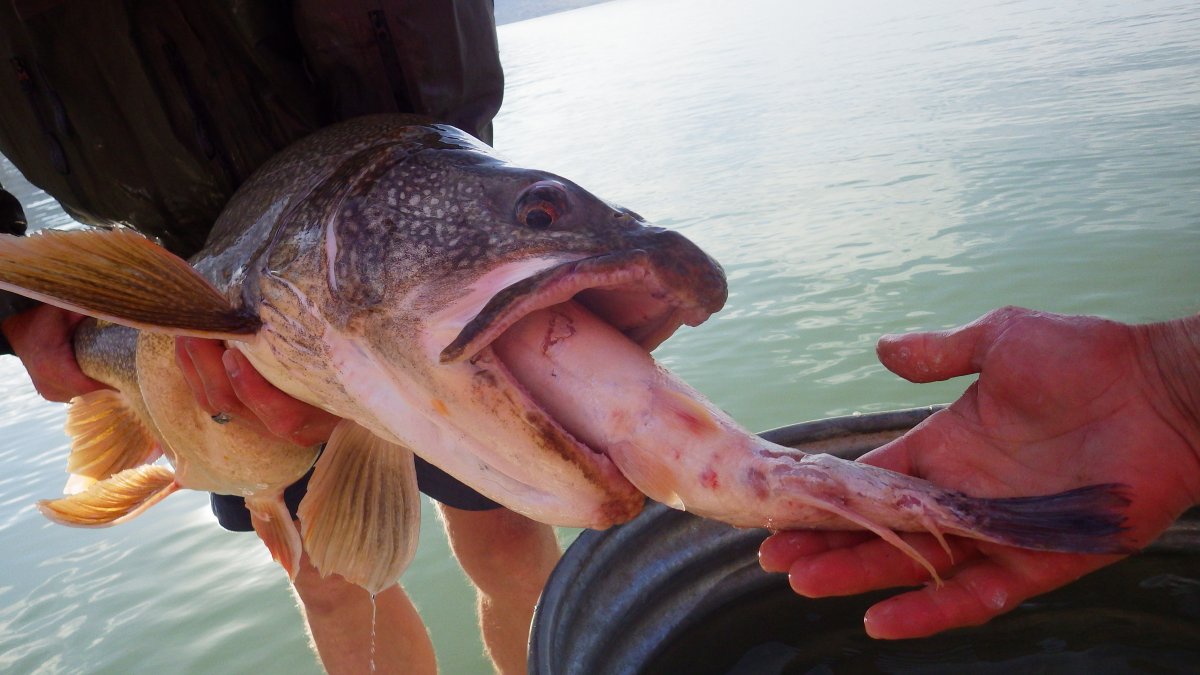
Accurate bathymetric mapping can play an important role in fisheries studies. A good bathymetric map can be used by researchers to identify habitat structures that would be prone to be used by various fish species, depths that those species are more or less likely to occur, or even shallow water hazards. An accurate 3D bathymetric map can be very important when estimating species abundance from either hydroacoustics, index netting, or other abundance estimating methods. These abundance methods are dependent on knowing the volume of water that was sampled. Abundance estimation will be important to determine the sustainability of the Yellowstone Cutthroat and Rainbow Trout fishery of Buffalo Bill Reservoir, which is faced with intense predation from both Lake Trout and Walleye.