
Introduction
Location Map
Base Map
Database Schema
Conventions
GIS Analyses
Flowchart
GIS Concepts
Results
Conclusion
References
![]()
GIS Concepts
GIS Concepts
Projection: A projection takes geographical angular data representative of the earth's 3D spherical shape and translates it into 2D to create coordinates that can be described within a Cartesian plane.
>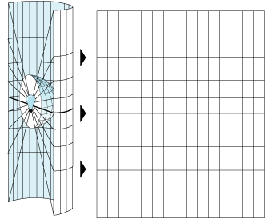
Image showing Geographic (left) and Projected (right)
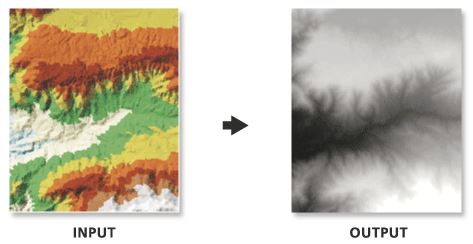
Raster Data: Raster is a file type that represents data in a grid of discrete square or rectangular cells with unique values. Often used with imagery and other geographic data. Raster files are used in many types of GIS analysis and have an extensive toolset.
Raster Calculator: Raster calculator is a tool useful for comparing raster datasets. Single Map Algebra expressions are created within this tool. The expression used within this analysis was a simple surface subtraction.

Create TIN: This tool takes point data and interpolates from these data a vector-based triangulated irregular network or TIN. This tool creates a surface through the Delaunay triangulation method that ensures that every point or vertex is intersected by the edges of triangles connecting out to the surrounding point data. Once all points are intersected, the tool removes the minimum interior angle to avoid a surplus of long, thin triangles. This tool should be used with a projected coordinate system because angular units of a geographic coordinate system can cause issues within the Delauney triangulation method.
TIN to raster: This tool creates a raster surface from your triangular irregular network (TIN) surface. This conversion allows you to run statistical comparisons between your TIN data and other Raster surfaces.
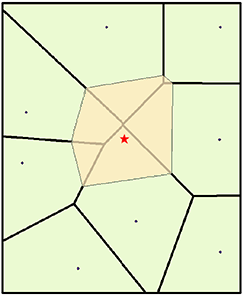
Natural Neighbor: This tool creates an interpolated surface from input data points by running a local algorithm. This means it uses a small subset of the surrounding points to create a polygon that is weighted proportionally based on the amount of overlap. In the figure above, the tiny triangle of overlap to the top right would be given a proportion of 0.38% while the area to the bottom left would be around 19%.
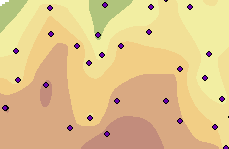
Inverse Distance Weighting (IDW): IDW is one of the simplest interpolation methods. IDW weights the value of each point by its distance to the cell being analyzed, and averages the value. IDW assumes that the unknown value is influenced more by nearby than far away points.
Kriging: Kriging is similar to IDW, where it forms weights from surrounding measured values to predict values at unmeasured locations. Like IDW, the closest measured values usually have the most influence. However, IDW uses a simple algorithm based on distance, but kriging weights come from a semivariogram developed by looking at the spatial structure of the data.
Clip: Clipping involves extracting input features that overlay the clip feature. This can be done through multiple toolsets and with multiple file types. It allows the user to extract out the study area for further analysis. 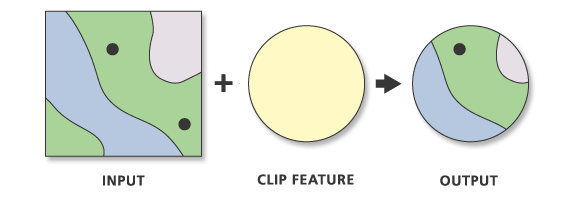
Extract Values to Points:
This tool extracts a value from the input surface(s) and joins that value to the input point feature. This is useful to evaluate how well the various surface tools represent the given point data by this interpolated surface.
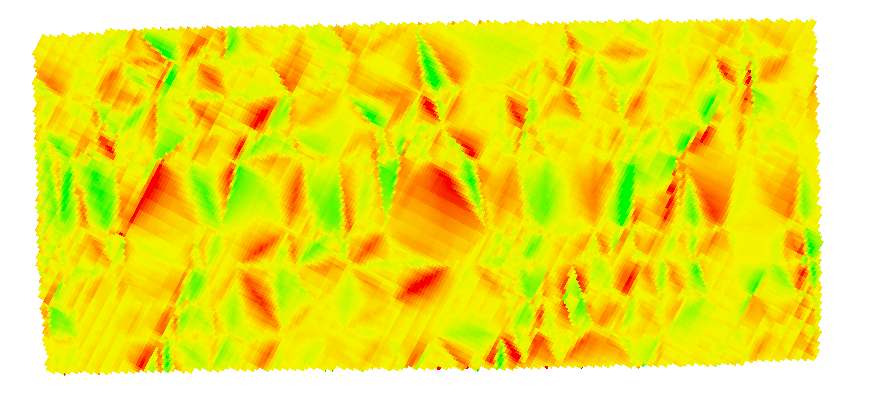
Surface Differencing: This tool creates an output surface that defines areas of volume increase and decrease between two overlapping surfaces. This tool only works for TIN surfaces or terrain datasets. Only the areas of overlap will be used by this tool, so no additional clipping is necessary.
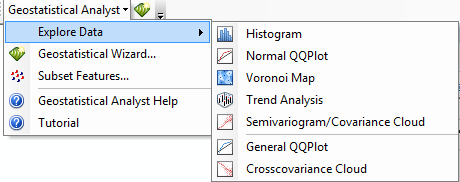
Geostatistical Analyst (and Wizard):
Available in ArcGIS is the Geostatistical Analyst extension and its wizard. This extension offers the capability for surface modeling using deterministic and geostatistical methods. The tools it runs are fully integrated with the GIS modeling environments and allow the user to generate interpolation models and assess their quality before using them in any further analysis. The Geostatistical Wizard is a dynamic set of pages that is designed to guide the user through the process of constructing and evaluating the performance of an interpolation model. Choices made on one page determine which options will be available on the following pages and how you interact with the data to develop a suitable model. The wizard guides you from the point when you choose an interpolation method all the way to viewing summary measures of the model's expected performance.
Subset Features:
Divides the original dataset into two parts: one to be used to model the spatial structure and produce a surface, the other to be used to compare and validate the output surface.
GA Layer to Points (Geostatistical Analyst):
Exports a geostatistical layer to points. The tool can also be used to predict values at unmeasured locations or to validate predictions made at measured locations.
GA Layer to Grid (Geostatistical Analyst):
This tool converts a Geostatistical Analyst Layer to Raster format