Results
Statistical Analysis Results
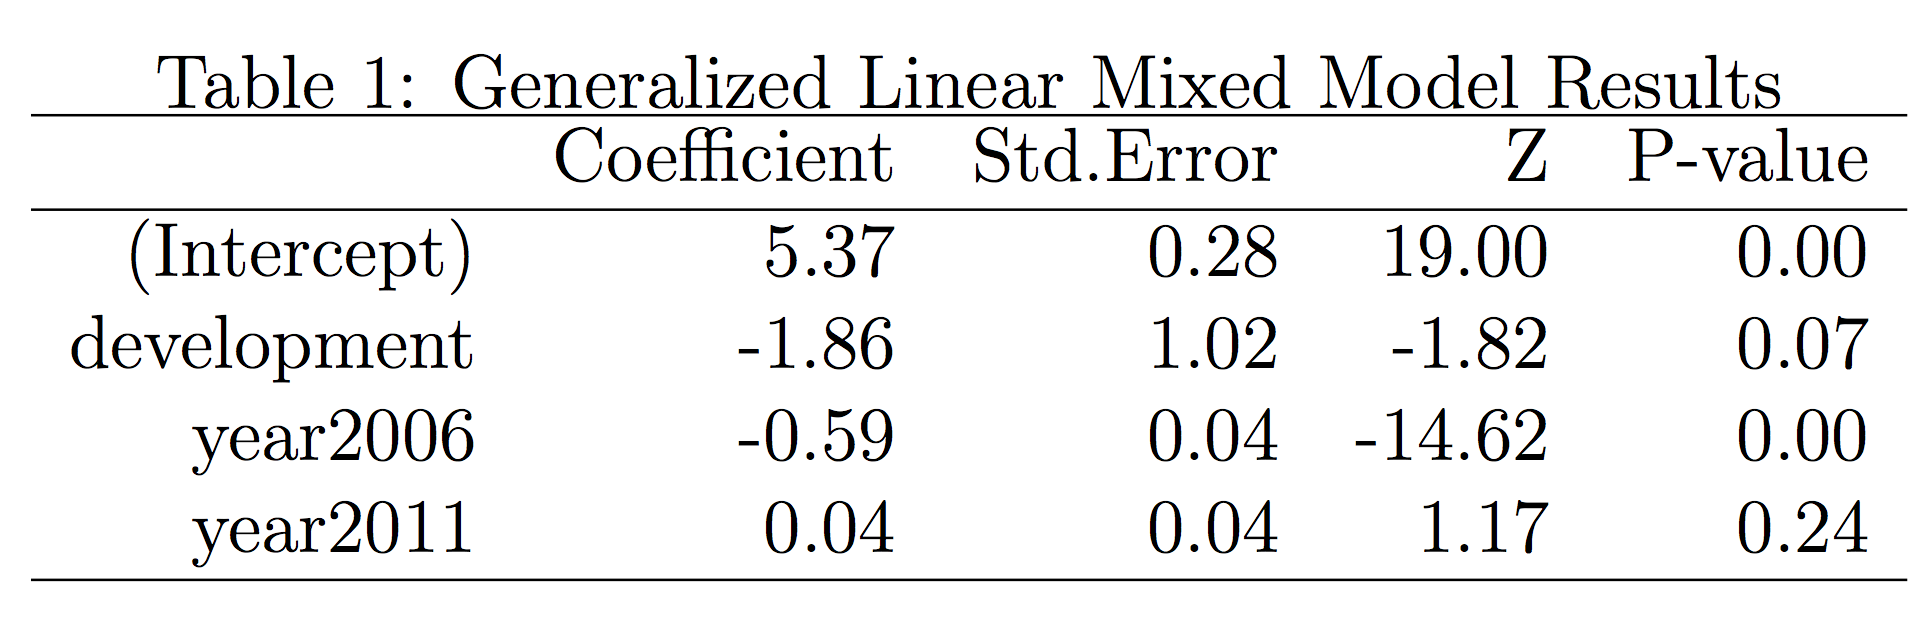
The mixed model approximated shows a marginally statistically significant effect for the percent development
on the number of elk surveyed in the region. We can conclude from the table that for every percent increase in development in the Estes Valley, the log of the average number of observed elk should decrease by -1.86 (se = 1.02). To interpret this coefficient on the scale of the count data, we can transform the coefficient. The result is that there will be a multiplicative decrease of exp(-1.86) = 0.155 (st.error=2.77) in the number of elk for every unit increase in the percent of development, holding all other variables constant.
The intercept term refers to the baseline year 2001 due to the construction of the design matrix for the fixed effects in the model.
There also is a significant relationship for the different years for the size of the elk populationn (between 2001 and 2006, but not for 2011). Since we expected the spatial distribution of the elk to be different since the exclosures were installed, this is not surprising. Also, because the distribution of elk between the years 2006 and 2011 was rather similar, this suggests that time should not be significant and this is exactly what we see occuring in the model estimates. The table below shows the estimates of the predictor coefficients along with their respective p-values.
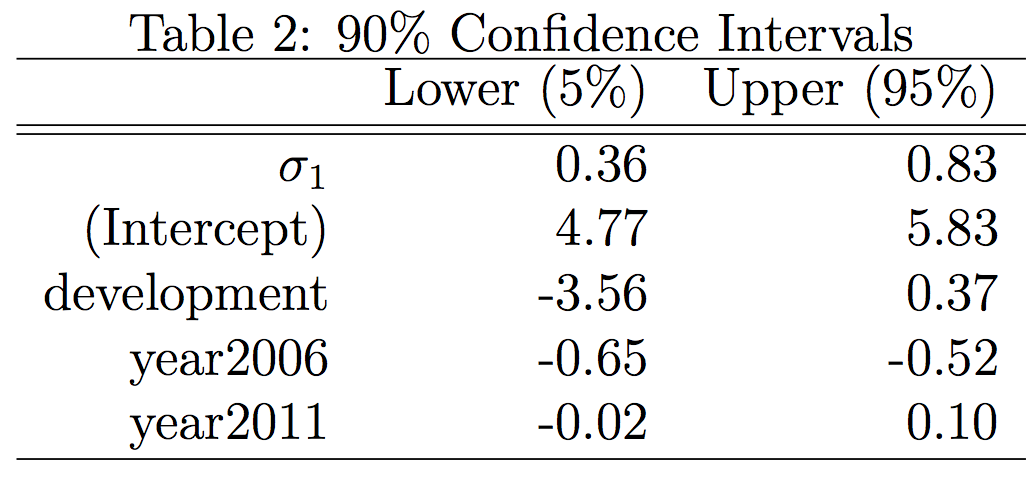
Additionally, below is a table for the 90% confidence interval of the coefficients for the fixed effects in the model.