Database Design
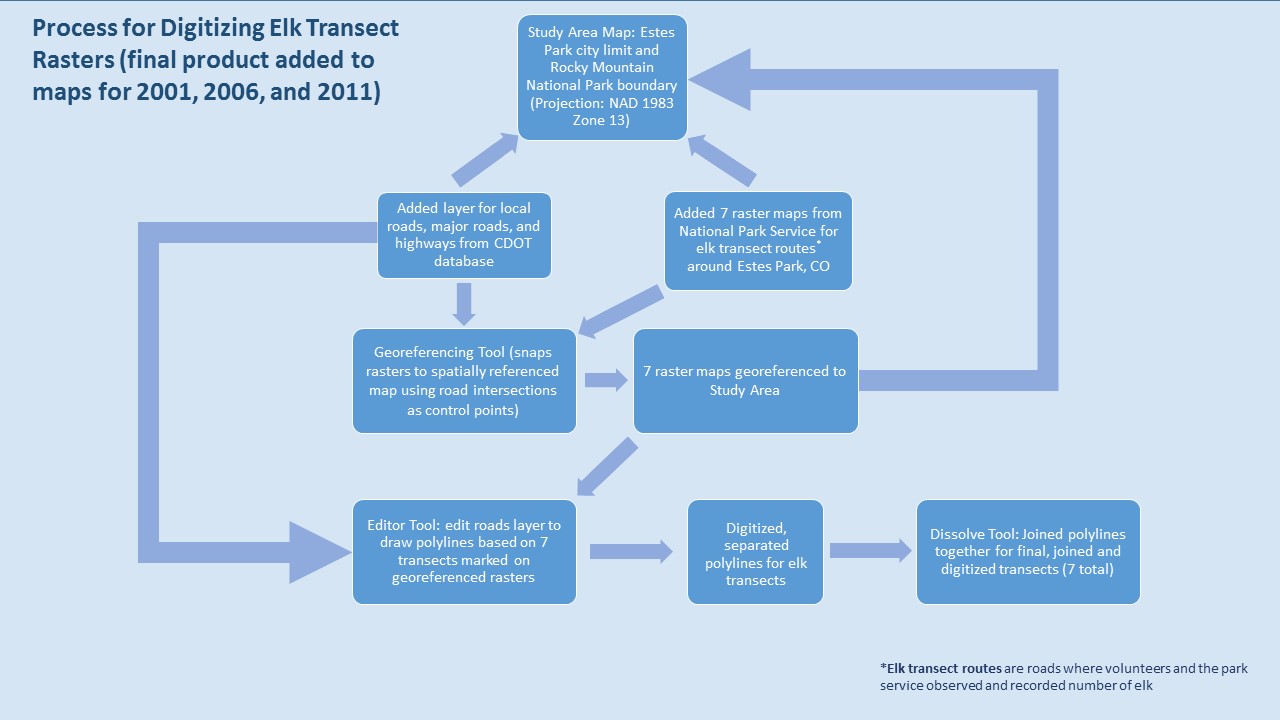
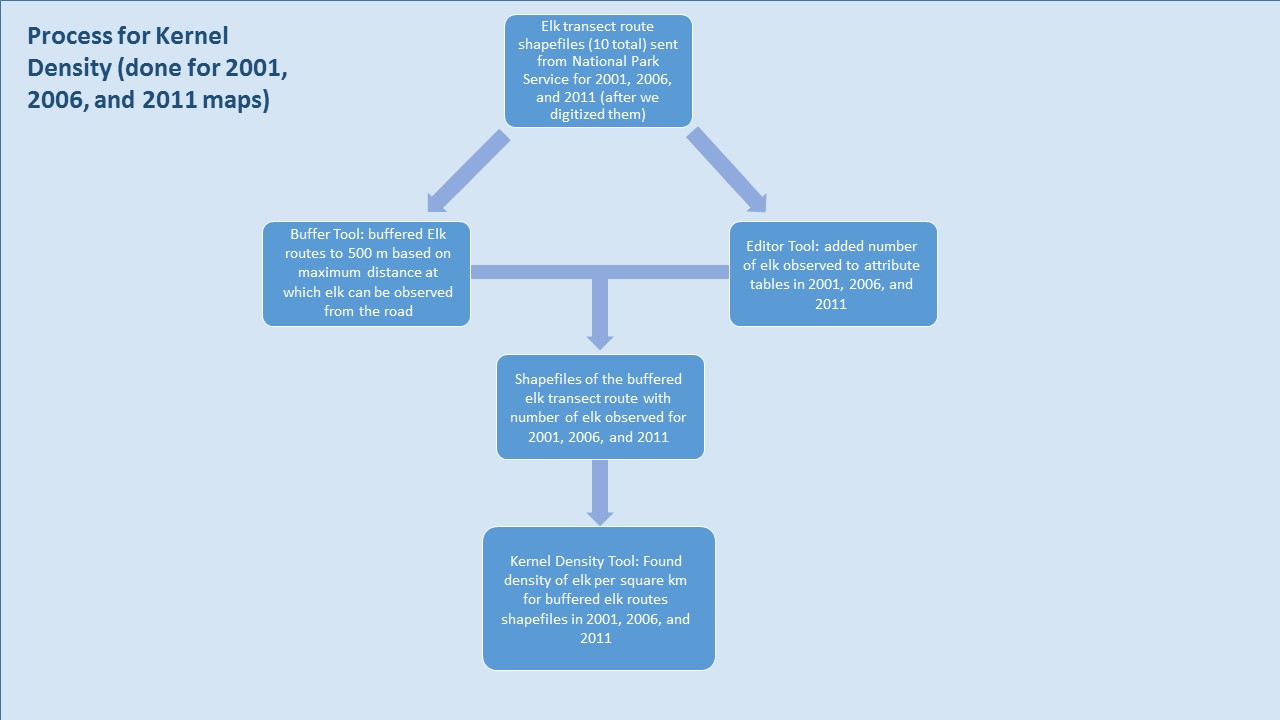
Flow Charts of Analysis and Data Processing
![]()
![]()
ArcGIS Models
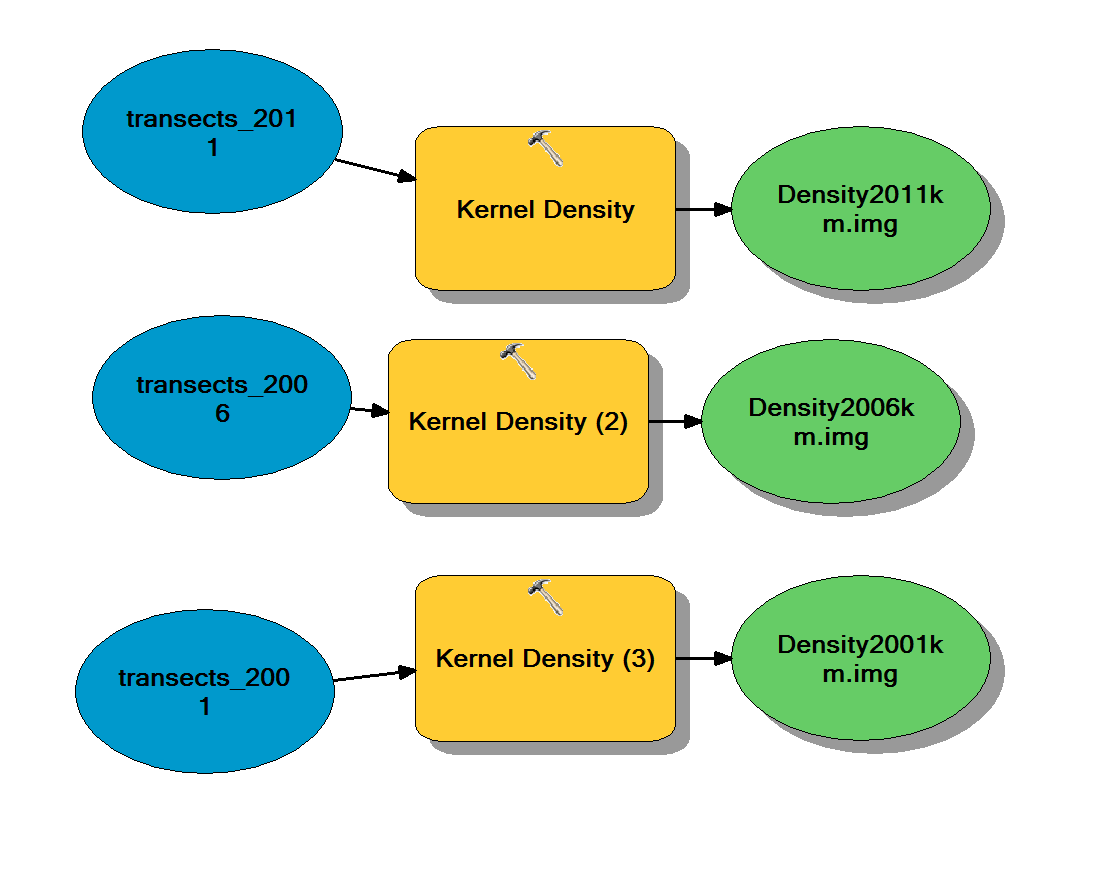
The following images show some of the models that we ran in order to complete the analysis.
Calculating the Kernal Density
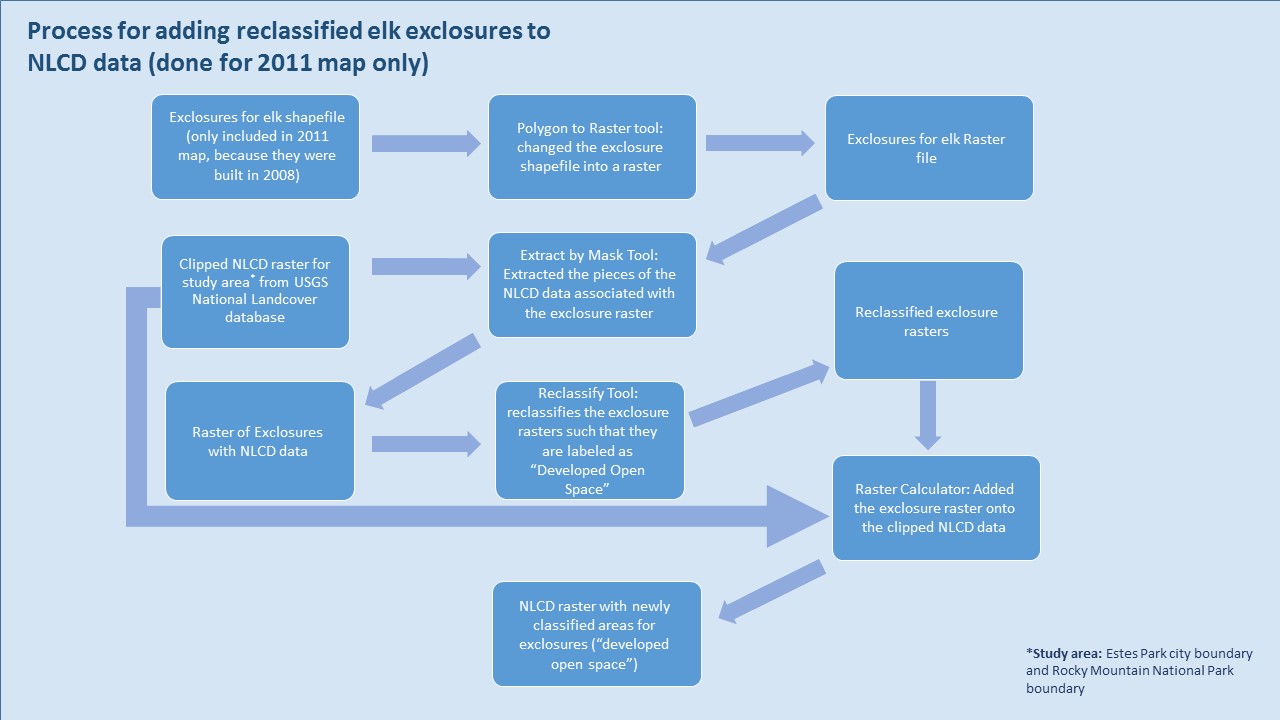
Clipping the NLCD data 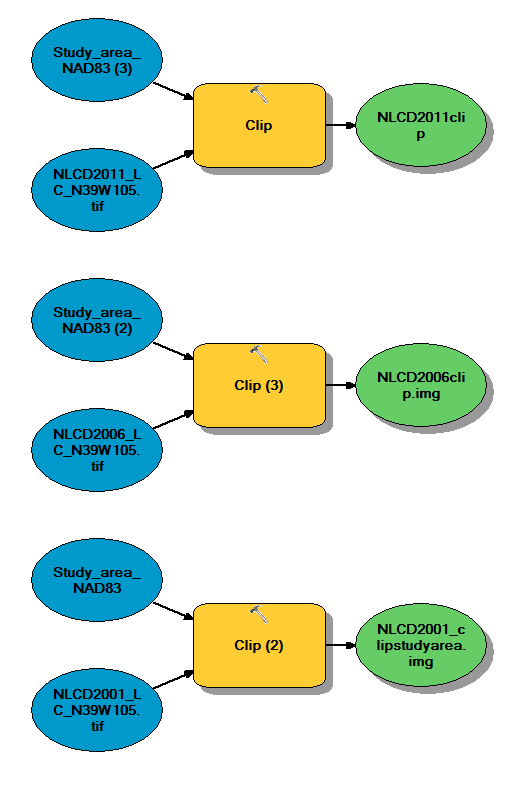
Combining the exclosure shape files with the NLCD data in order to calculate the percent of development 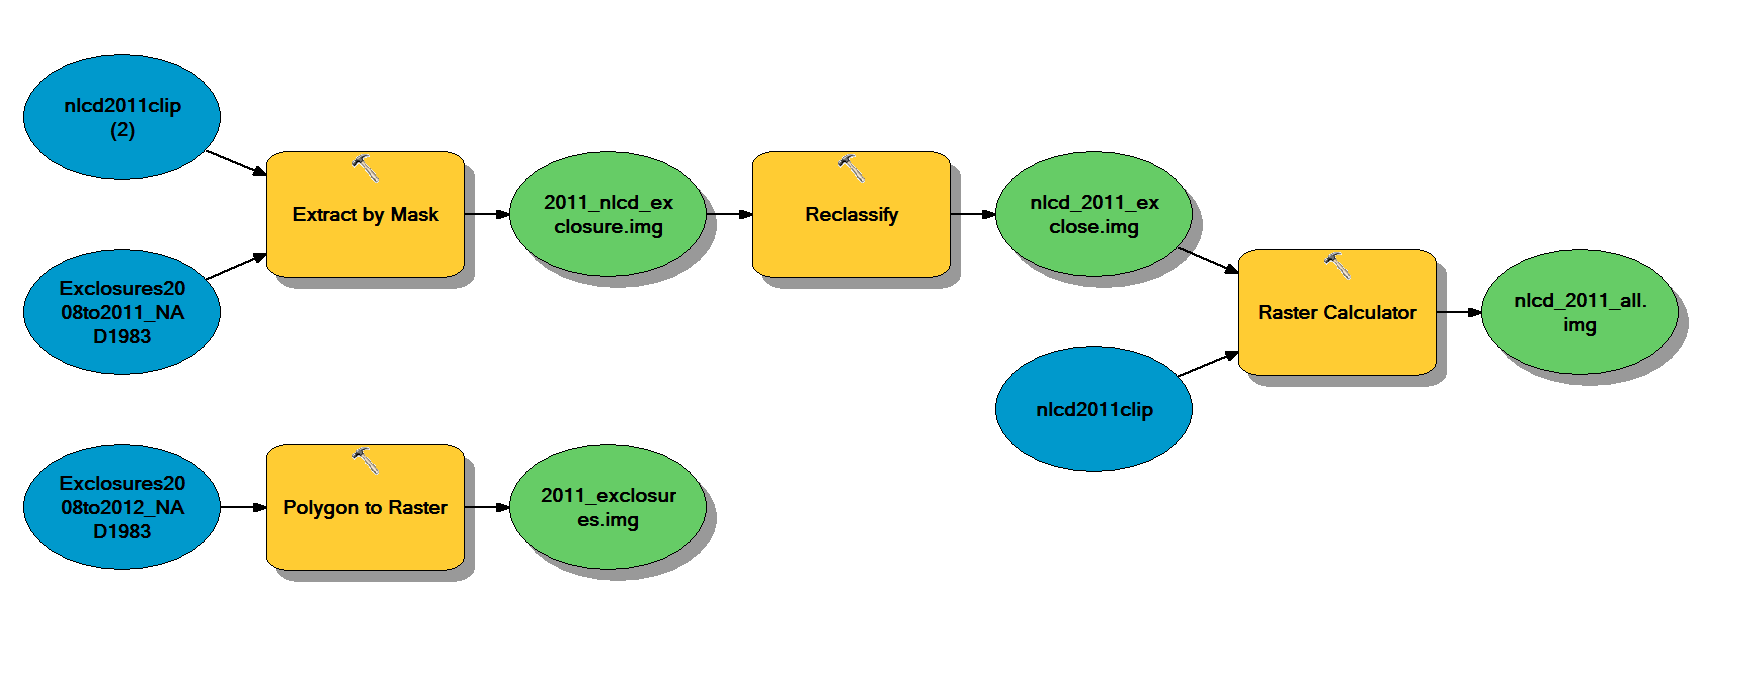
Spliting the buffered transects in order to calculate the percent development (used in a different model) ![]()
Calculating the percent of developed land by transect for 2001 (2006 and 2011 are not shown, but used similar models) 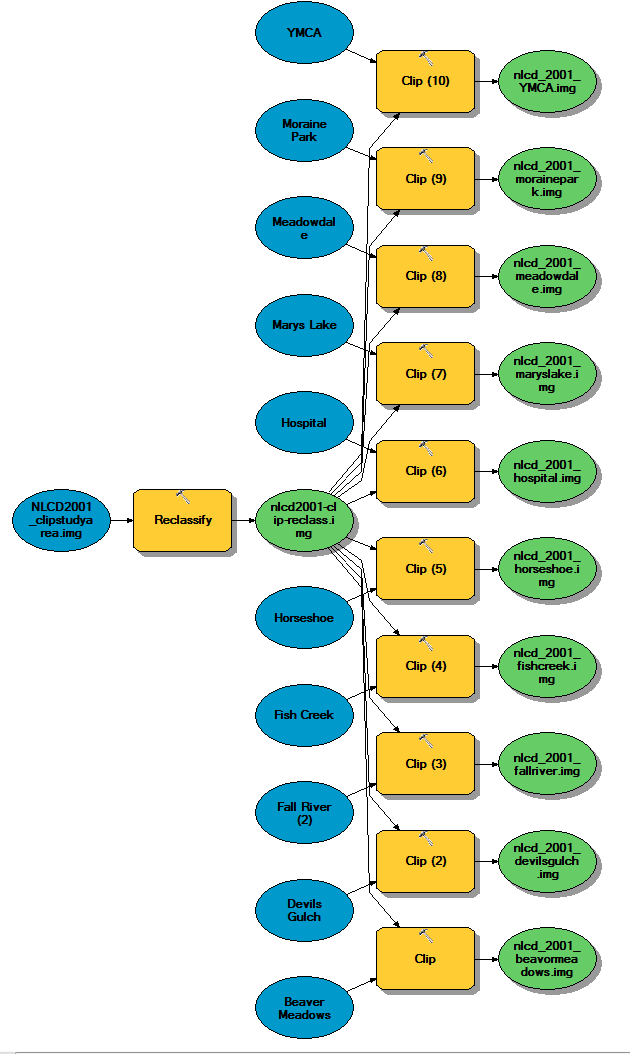
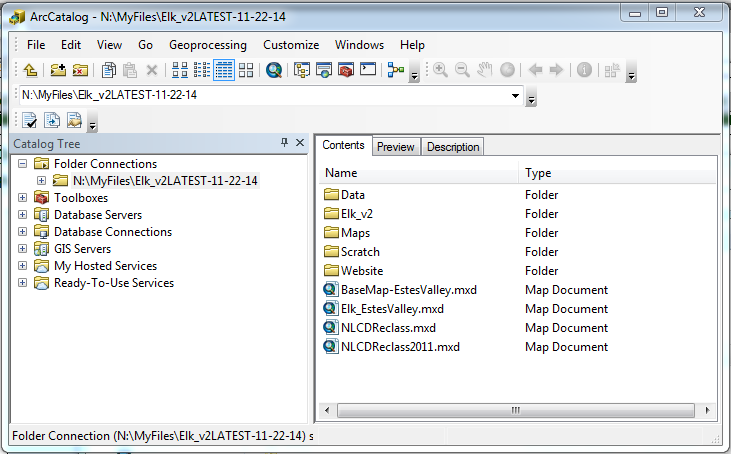
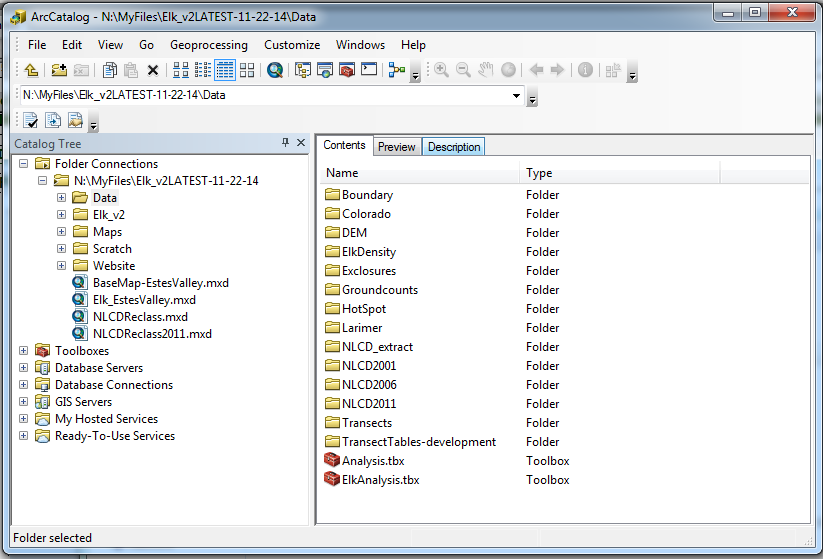
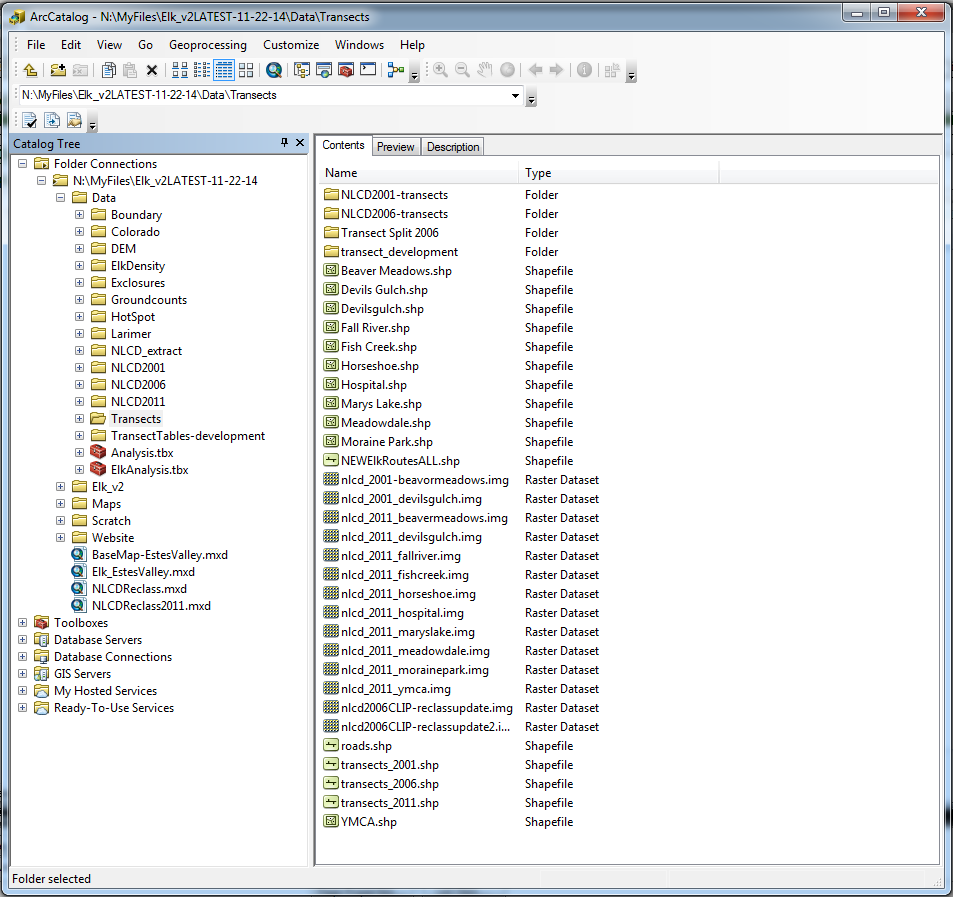
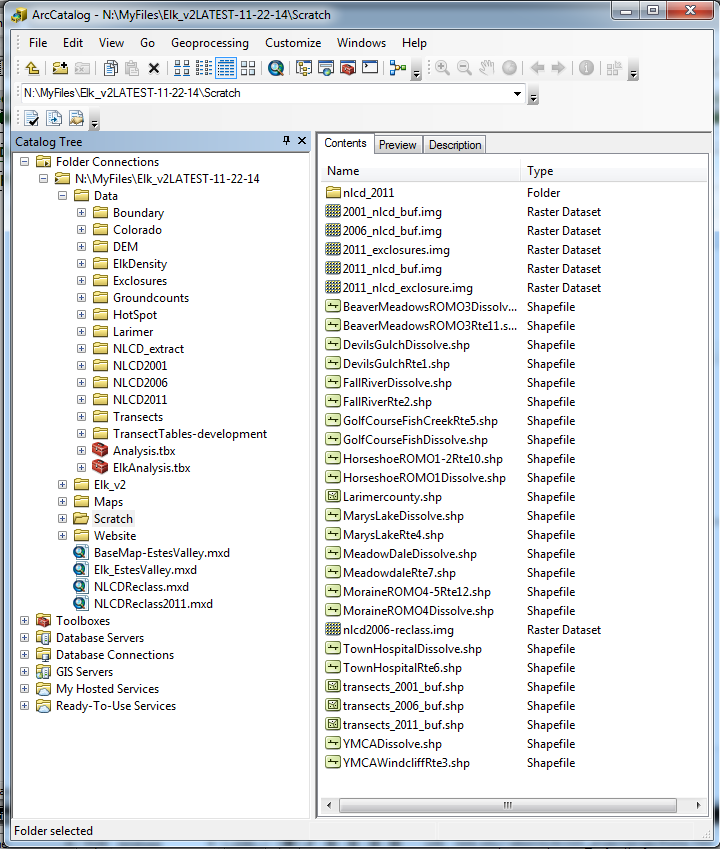
Database Images
We did not specifically use a geodatabase because we learned in lab that it was not worth the effort to construct it. Instead, tried to maintain a rigorous file system for organizing all of the data, created data, scratch, maps, etc.