Introduction
Location Map
Base Map
Database Schema
Conventions
GIS Analyses
Flowchart
GIS Concepts
Results
Conclusion
References
Flowcharts
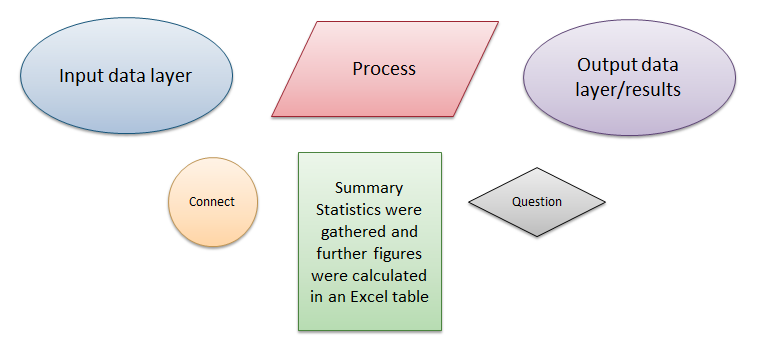
Key:
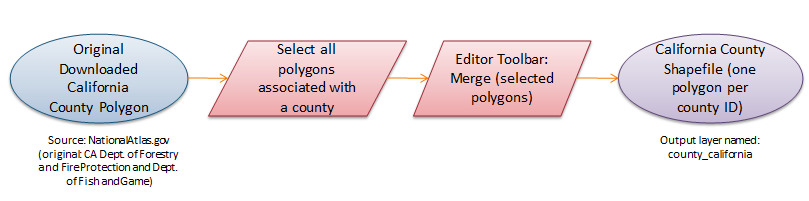
General California:
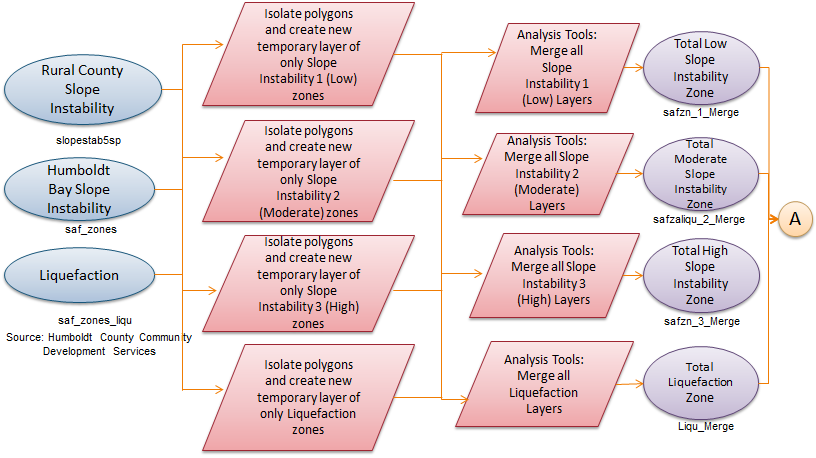
Flowchart for merging the multiple polygons attributed to each California County into singluar polygons:
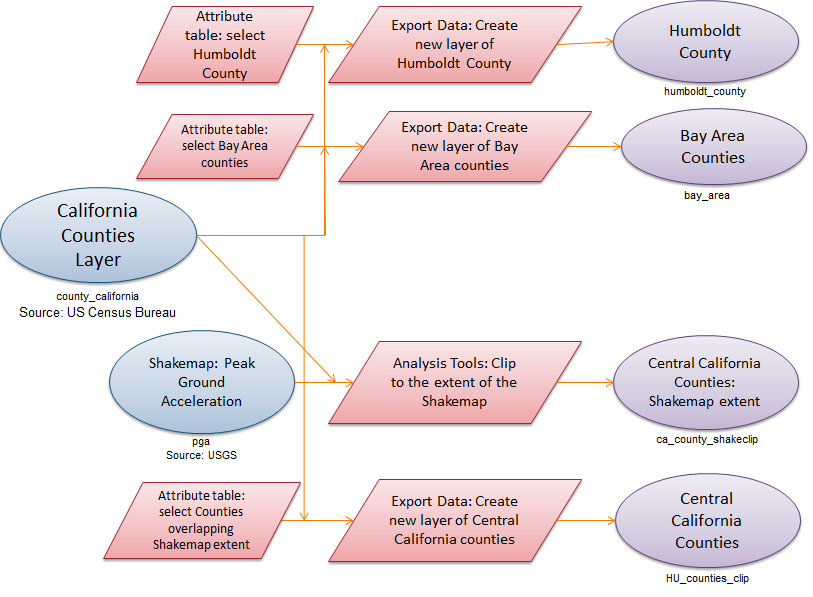
Flowchart for creating Location Map and case study areas:
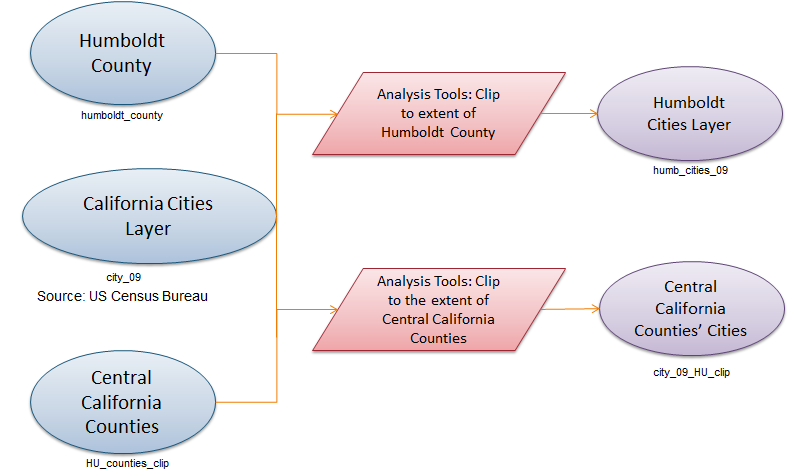
Flowchart for creating city layers for Case Studies 1 and 3:
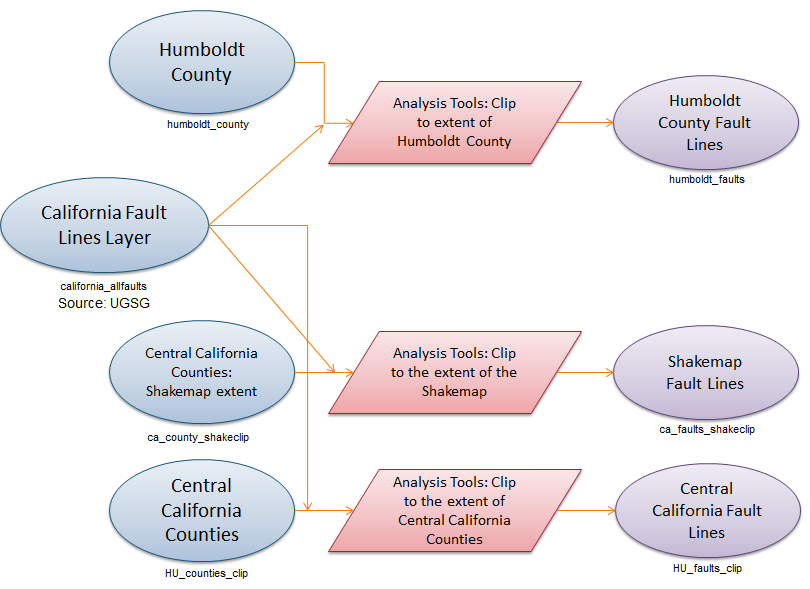
Flowchart for creating fault line layers for Case Studies 1 and 3:
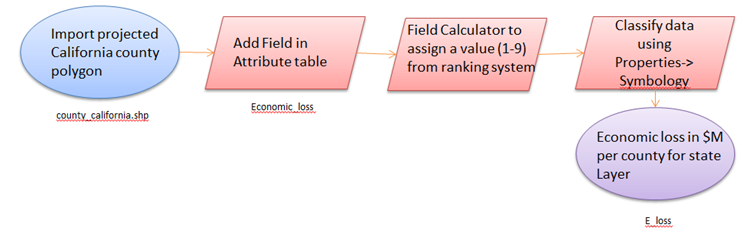
Flow chart for Annual Economic Loss due to building damage
Case Study 1: Humboldt County
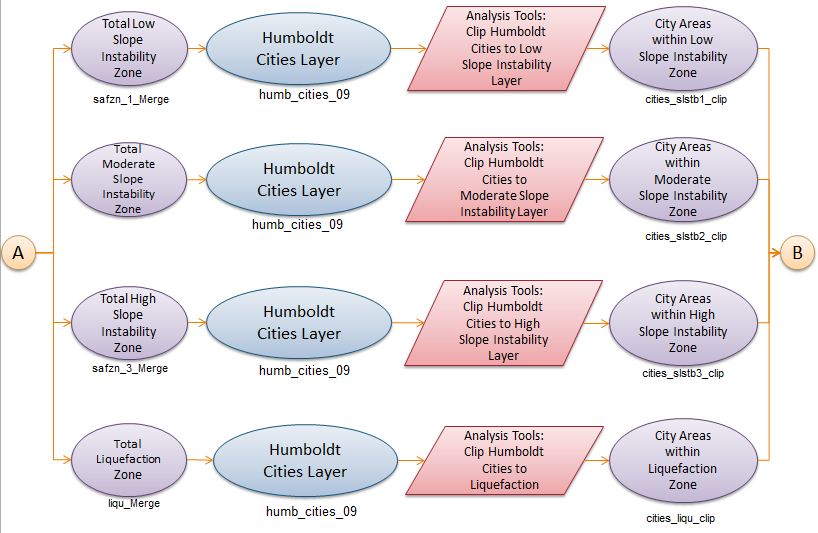
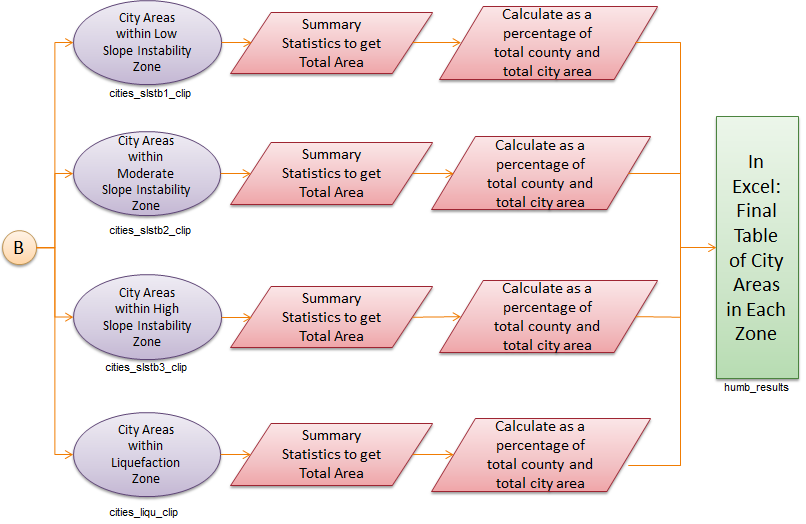
Flowchart for determining total Humboldt County city areas within each type of risk zone:
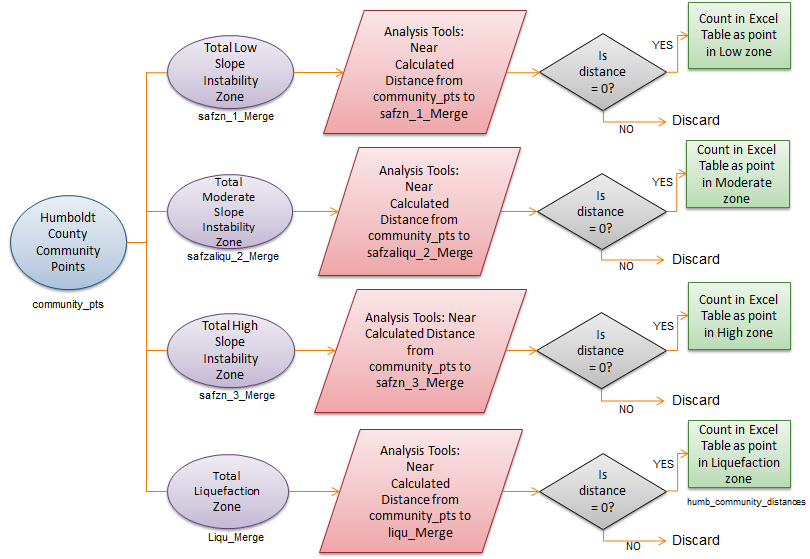
Flowchart for determining which (and how many) community points were in the various risk zones:
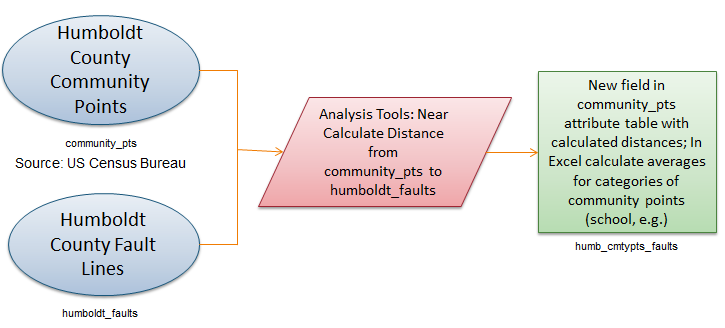
Flowchart for determining distances from community points to nearest fault line:
Case Study 2: Bay Area
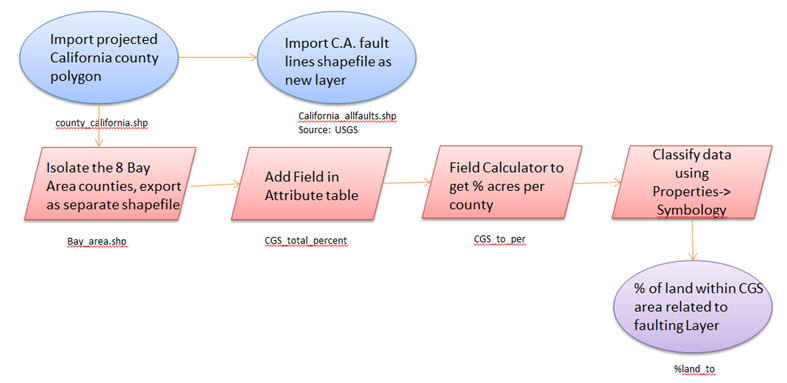
Flow chart for Percent of land per county that resides within a designated CGS study zone "Case study 2: Bay Area"
Case Study 3: Central California
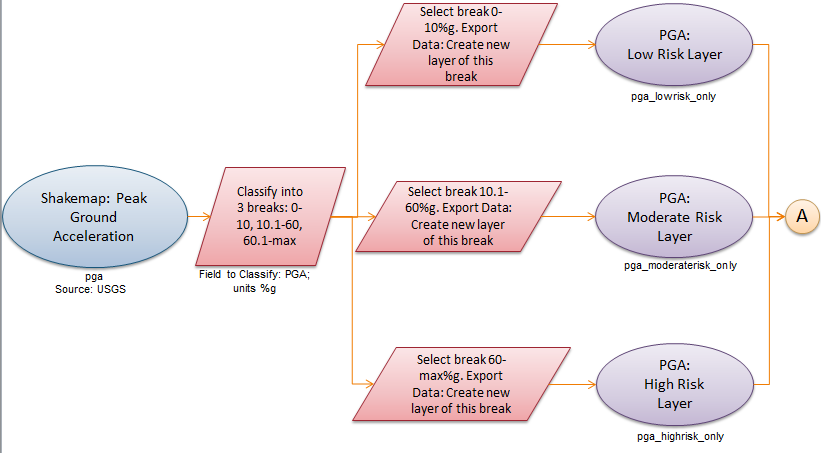
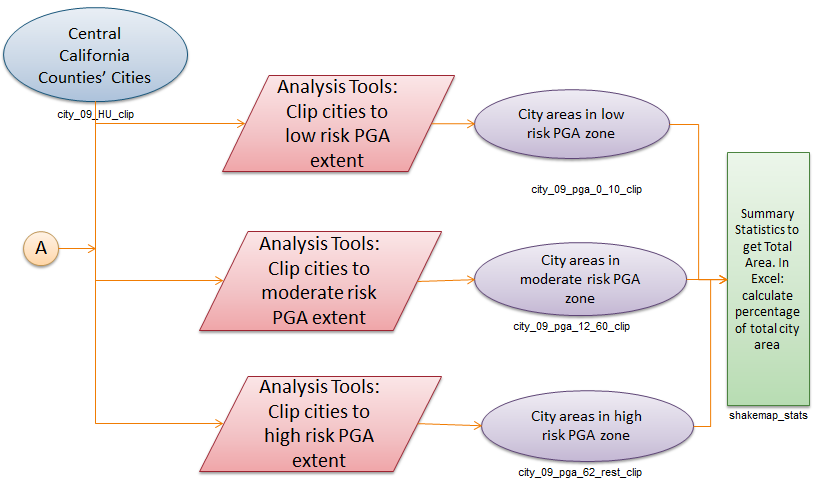
Flowchart for determining city areas within the three PGA risk zones:
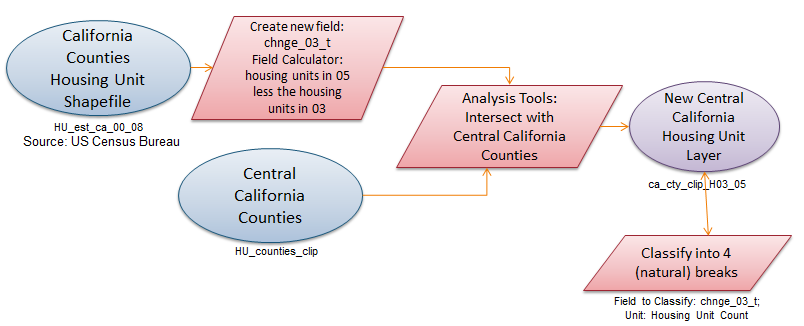
Flowchart for determining Housing Unit Changes from 2003 to 2005 in Central California Counties:
You can view the results of the processes outline in the above flowcharts on our Results page.
Last Modified December 7, 2010.