Introduction
Location Map
Base Map
Database Schema
Conventions
GIS Analyses
Flowchart
GIS Concepts
Results
Conclusion
References
Conclusions
Based upon the three different case studies that we've outlined we've arrived at three different spatial conclusions as outlined below. Since earthquakes are an integral part of the California lifestyle, all the relationships that we've investigated are relevant to understanding risk assessment and how residents can better educated themselves about these natural disasters. As seen in the results section, projected annual economic loss from such an event can be devastating. The information discussed is used in assessing earthquake insurance rates as well as hazard outcomes as predicted in FEMA's HAZUS software, thus our presented analyses and results can be enlightening on how professional researchers determine risk.
Case Study 1: Humboldt County
This study illustrated the ways land is characterized for stability. Low, moderate, high and liquefactionrisk zones were identified and percentage of city (developed) areas in each zone were calculated. While much of the county (30.83%) is characterized as being highly slope instable land, a small proportion of the cites are in this zone (7.79%). Additionally, only 6.73% of the city areas are in danger of liquefaction. This can be a means of identifying areas of cities where damage is most likely to occur in the event of an earthquake. These might be the structures residents should look into insuring. When looking at distance from community points (like schools, hospitals, airports, etc) to fault lines and risk zones, we found that most points were within a couple miles of a fault line but most points were in low slope instability or stable zones (though there were a few in the higher risk zones, see results for final numbers). This indicates that in general, even though most community points are very close to fault lines, if an earthquake were to occur, these structures sit on relatively stable land so epic damage is less likely. Those structures that do fall in riskier zones should be assessed for structural safety as a precaution.
Case Study 2: Bay Area
As a result of a zoning act in 1972 California is now required to have potentially dangerous fault zones mapped by a Geologist prior to any construction that is centered around human occupancy. These California Geologic Survey (CGS) "study zones" represent the acreage that cannot be built upon (unless for use other than occupancy). This case study focused on the percentage of the land within the eight counties of the Bay Area (Sonoma, Marin, San Fransisco, Solano, Contra Costa, Alameda, San Mateo, and Santa Clara) that has been professionally mapped and designated as a "study zone." Overall the percentages are quite low which was surprising (< 4%) given the amount of faults that run throughout the area. Surprisingly San Fransisco county has no land within a zone whereas San Mateo has the highest percentage. It should be mentioned, however, that the percentages are based on the total amount of land within the county thus this figure isn't useful for any sort of inperpretation.
Curiosity paved the way to investigate the relationship of the percentage of study zones to the density of fault lines. The figure below represents the new percentages based on the re-calculated formula:
(total acreage per county in CGS zone)/ (total amount of acreage within CGS zone for entire Bay Area) * 100
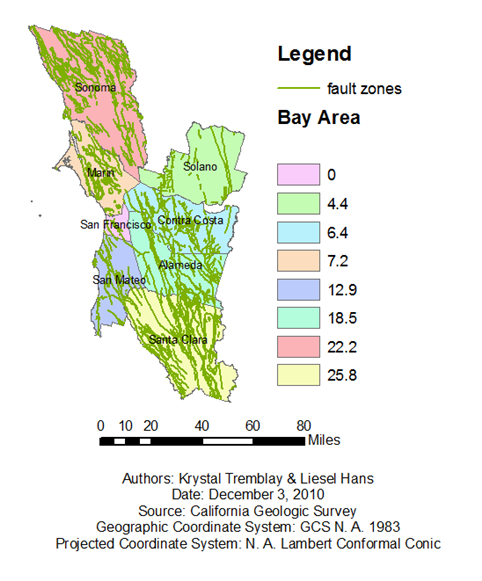
This map represents a better correlation between percent of acreage within a CGZ zone for entire Bay Area and fault distribution. Notice that the counties that have a high density of faults (i.e. Santa Clara, Sonoma, and Alameda) also have the highest percentages. What is interesting is the fact that San Fransisco county still has a 0% of study zones yet there are clearly faults running though the area. This makes us question how the "study zones" are mapped: is there a higher acreage for those faults that are more active (weighted system)? Are all faults mapped? Or is it only done when construction is set to begin?
Case Study 3: Central California and Shakemaps
In light of the USGS program "Did you feel it?" which creates a community generated shakemap (see the Introduction for more information) we investigated two of the layers that go into instrumental shakemaps: Peak Ground Acceleration (PGA) and Peak Ground Velocity (PGV). We used a shakemap from the September 28, 2004 6.0 magnitue earthquake near Parkfield, California in Monterey County. This earthquake is especially interesting because it is part of an ongoing project reseraching the fact taht earthquakes of magnitude 6.0 have been occuring on this portion of the San Andreas fault about every 22 years for the last 150 years. See the Results section for more information. Based on research of these parameters we classified the affected counties by low, moderate and high risk of damage zones. In classifying PGA we learned that risk to older homes typically occurs beyond 10%g (below 10%g is 'low' risk), while significant damage to newer homes may not occur until a pga of beyond 60%g (high risk). We determined city areas in these zones. Luckily, no U.S. Census Bureau defined cities fell into the high risk zone, and only about 25% of these counties' cities fell into the moderate zone. This illustrates that damage was probably minor for newer homes and more significant for older homes in the moderate risk areas. In the low risk areas, damage was likely very minor all around. We classified PGV into two categories based on the notion that 10cm/sec is the threshold for liquefaction (and thus significant damage) to occur. The final bit of this exploration was to look at U.S. Census Bureau Housing Unit data for the counties before and after the earthquake (from 2003 and 2005). We looked at the change in housing units and found that instead of decreasing like we might expect in an earthquake when damage is significant, housing unit numbers increased like normal over the years. This is likely due to the fact that any damage that ensued from the earthquake was not major enough to wipe out an entire housing unit. Even it if was, they might have rebuilt by 2005. For more interesting analyses of actualy damage estimates, a better data set or proxy for damage needs to be found.
In closing,
Ideally we have shown you the basics of how one might determine risk and probabiliy of damage. This is meant to inform the public about the science behind earthquake hazard assessment and lead viewers toward sources that provides scientific, professional and community-driven educational earthquake information.
Thank you for visiting!
Last Modified December 7, 2010.