Introduction
Location Map
Base Map
Database Schema
Conventions
GIS Analyses
Flowchart
GIS Concepts
Results
Conclusion
References
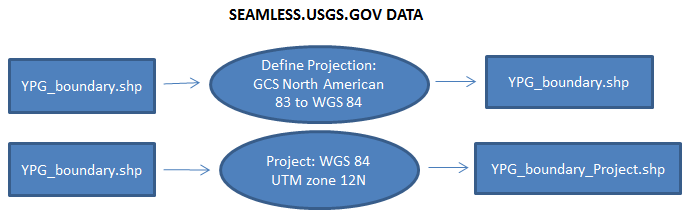
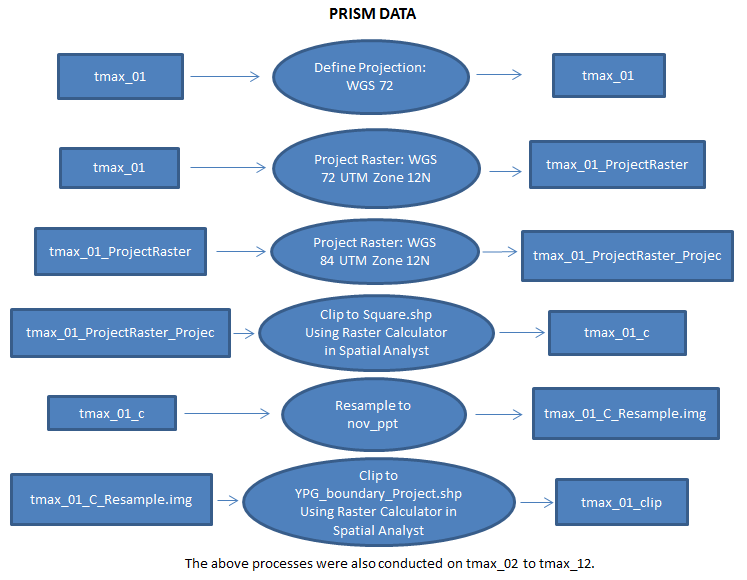
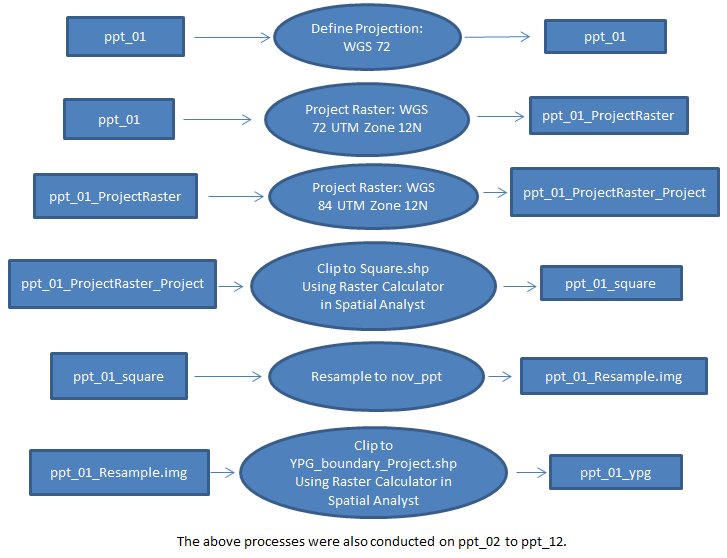
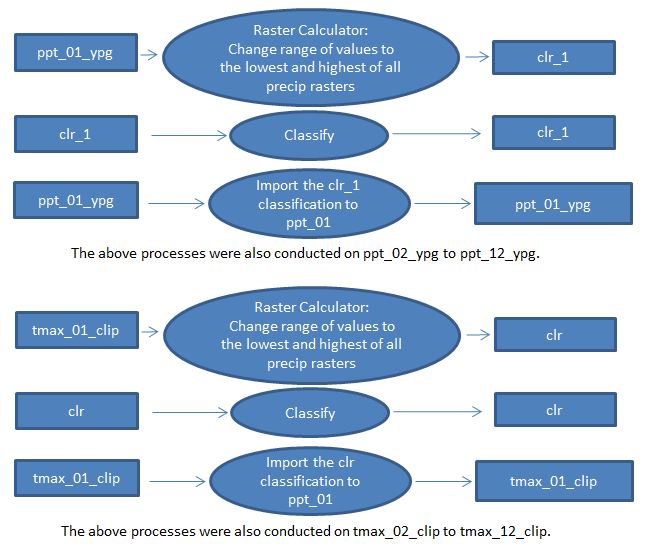
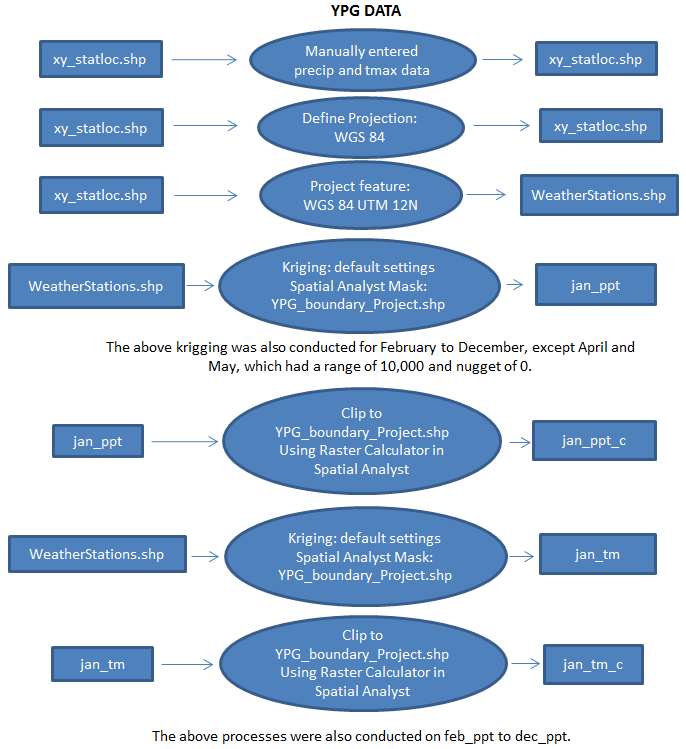
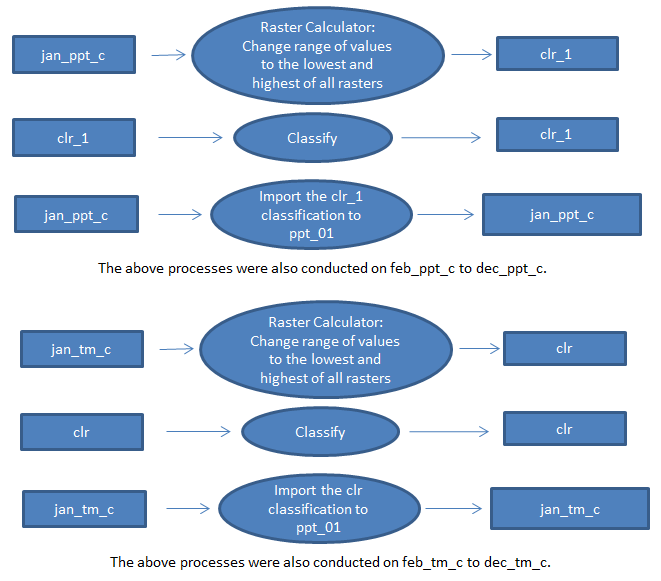
Flowchart
These flow charts explain the GIS analyses conducted for this project. The GIS analyses are illustrated for the data derived from seamless.usgs.gov, PRISM, and YPG. The format of the flowchart is Data layer -> Process -> Ouput data layer.