Introduction
Location Map
Base Map
Database Schema
Conventions
GIS Analyses
Flowchart
GIS Concepts
Results
---Regional
---Site
Conclusion
References
GIS Analysis
The study area for this project is a large section of the eastern portion of the Lake Patzcuaro Basin, Michoacán, Mexico. Previously proposed prehispanic routes for the east-west corridor into the lake basin, the geo-political core of the Purépecha Empire, had been proposed by different archaeologist based on ethnohistorical accounts. However, recent archaeological investigations (LORE-LPB Archaeological Project, Colorado State University) at SA1 archaeological site have documented traces of roads, routes, and passages suggesting different scales of communications: intra-household (passages), intra-site (roads), and inter-regional (routes). The entire region consists of a rugged area, product of recent volcanic (Holocene) activity. The urban center of SA1 archaeological site is located on top of an extensive and recent lava flow (~ 8 km2). This project utilizes a GIS methodology to prepare and weight hypothetical inter-regional and intra-site routes.
We used a simple GIS analysis to offer a possible answer to the following specific archaeological research question. What route across the landscape
could have possible been used to transport obsidian from Maravatio and Ucareo/Zinepacuaro mines (periphery) into the core region of Tzintzuntzan? Our hypothetical corridor was processed at two different scales: Regional and Local to take into consideration a hypothetical route which run through SA1 archaeological site into Tzintzuntzan, the Empire's capital located near the shore of Lake Patzcuaro.
The understanding of these hypothetical prehispanic routes are significant for archaeological studies to better model economic and socio-political dyamics between the periphery and the core relationships of an Empire. Associated with prehispanic routes and transportation is energy cost, since the only means of transportation during this period was by hiking. There is a real biological cost associated with movement through complex terrain. Different routes require different amounts of energy. Organisms tend to optimize their effort (conscientiously or through behavioral selection) in order to reduce energy expenditure, so that saved energy can be used for other activities required for survival and reproduction. There are many factor that influence the cost of movement. We focused on costs associated with slope and distance. As slope and distance increase between two points, so does the cost associated with movement between the two points. We also consider cost associated with movement through a human development. A more complex neighborhood that forces a person to wander perpendicular to their destination will cost more than a route allowing the person to walk directly to their destination.
In order to answer our research question we had to work within two different scales. Thus, we dividided our analysis into a regional analysis and a local (intra-site) analysis. The regional analysis considered only slope and distance in the cost. The local scale (SA1 archaeological site) considered the structures and transportation infrastructure of the surveyed site in addition to slope and distance.
Analysis Steps and Reasoning
There were additional steps required to get to the point where we started the analysis. First, we developed "friction surface" for both the regional and local scale analysis. For the local scale analysis, we used GPS tracking points collected during two archaeological field seasons (LORE-LPB Archaeological Project-CSU) using a sub-meter accuracy Trimble Geo-X GPS receiver. The survey points were taken while mapping and documenting archaeological features such as walls residential and civic-ceremonial structures, terraces, plazas, and artifact provenences. For this project geodatabase, all the field data was compiled into various shapefiles representing each type of feature (i.e., polygon for structures, lines for walls) into their appropiate feature class.
The local scale friction surface was derived from all high density raw survey points within the 2009-2010 survey boundary. During the survey the GPS receiver continually recorded both coordinate location and elevation, both of which were post-processed and corrected using the Toluca base station in Mexico to increase accuracy. At the time of analysis the best DEM for the study site had 30 m x 30 m cells (ASTER). The application of the least cost path algorithm required to convert all the vector data to raster format with a cell size of 0.5m for the local (intra-site) and 30 m for the regional scale. The 0.5 m cell resolution was considered acceptable to better model the hypothetical movement of people in a highly dense populated urban core like SA1 archaeological site. Thus, our question at the local scale required a finer resolution DEM for more realistic cost estimates. Using the survey points GPS tracking position and elevation data we constructed DEM using kriging (spatial interpolation). We did spherical krigging with output cell size set at 4 m. Interpolation between known points can be done in many ways, so we decided to create a TIN (Triangulated Irregular Network) and a DEM using Kriging Interpolation. The TIN was converted into a raster and later compared to the DEM (Kriging) by taking the different between the rasters using raster calculator.
/sitedemcreation.png)
Raster TIN and DEM (Kriging) Comparisson
Single click on images to reduce size. Double click to enlarge.
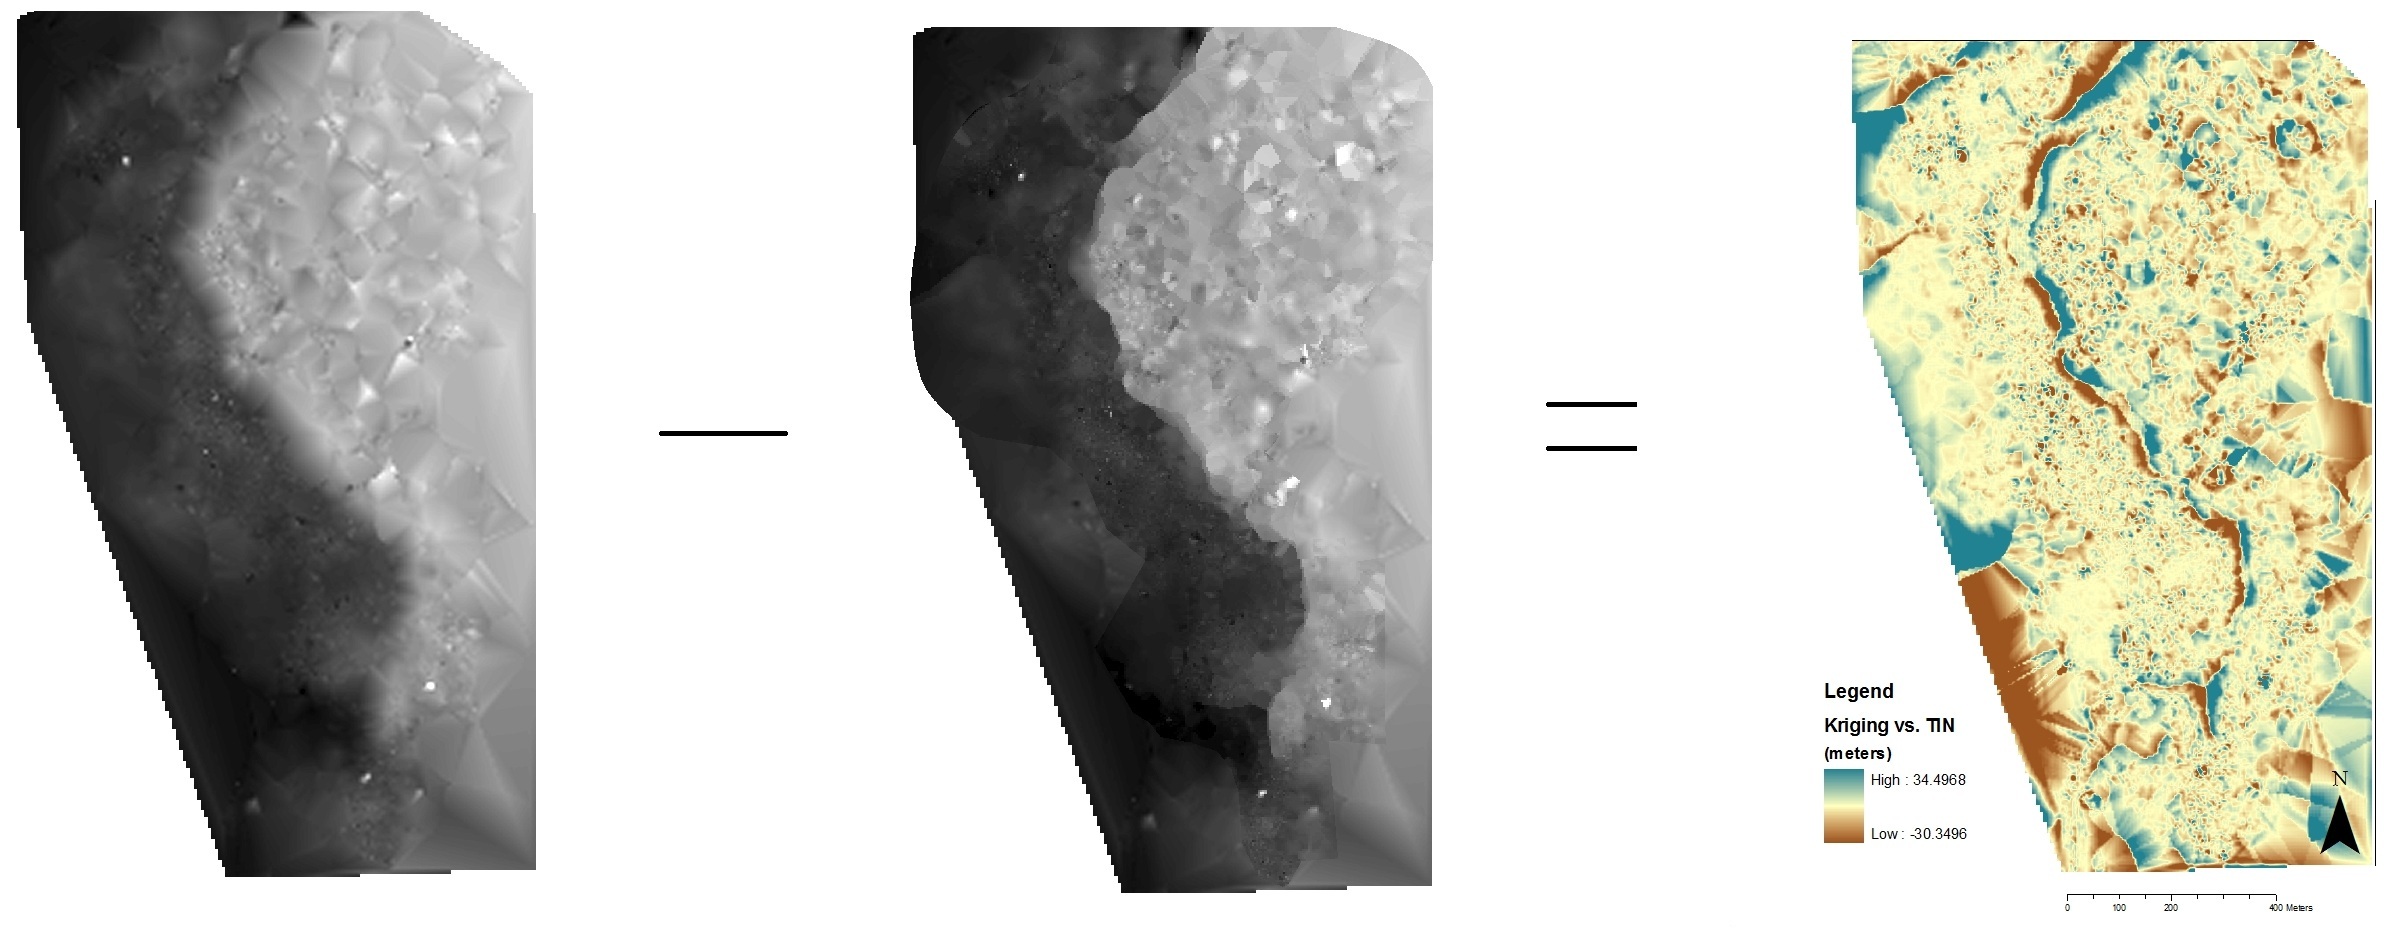
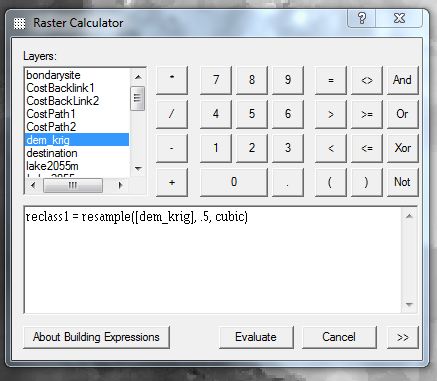
As one might expect the areas with a high density of survey points have very good agreement between the two interpolation methods, areas further from point clusters had a much higher difference (somtimes as high as 30 m). We used this to guide our analysis by deciding to use the regional 30 m DEM for the outskirts of the project region (Regional Scale) with few or no points. The output DEM ( 4 m resolution) was still a spatially course, so we resampled this raster using the raster calculator function resample (input,cell size, method). We used a cubic polynomial fit to create a smoother raster at .5 m resolution.
Single click on images to reduce size. Double click to enlarge.
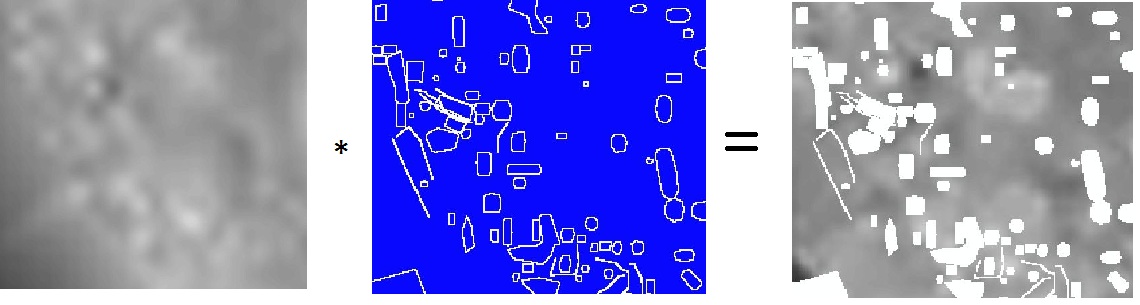
The second step was to incorporate strutures (no pass zones) and transits zones data to the raster friction surface created in the previous step. First we eliminated areas where movement is prohibited (archaeological features) by assigning "NoData" to those cells of the previously created DEM. All the "no pass zone" (archaeological features) were converted into line features. These were then converted into a raster "no_transit". At this point all areas with data (structures) were identified and reclassified as "NoData", so those cells containing no archaeological features (structures) were assigned a value of "1" and cells with data were assinged values of "NoData". Using raster calculator the reclassified "no_transit zone" (no data) raster can be multiplied by the DEM (Kriging) for the site. This creates NoData holes in the DEM (Kriging) where structures are located; thus, eliminating them from being considered for the cost path at the local scale (intra-site).
Single click on images to reduce size. Double click to enlarge.
/leastcostpathcprocesses.png)
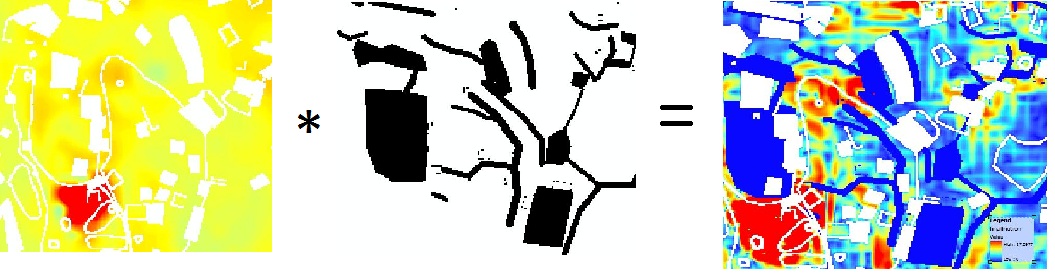
At this point, we derived a slope analysis from the DEM (Kriging) for the site, before we incoorperate transit zones. In order to incorporate and consider transit zones for the final (local scale) friction layer, we converted our transit zones polygons into a raster. Then, we reclassified the layer where transit zone cells are given the value of zero, and NoData cells areas are given the value of one. At this point, we used raster calculator to multiply the transit zone raster by the slope raster, where cells with without transit infrastructure are multiplied by 1 (unchanged), and areas with transit infrastructure (roads, trails, and plazas) are multiplied by zero assigning this area as low cost for cost path.
Single click on images to reduce size. Double click to enlarge.
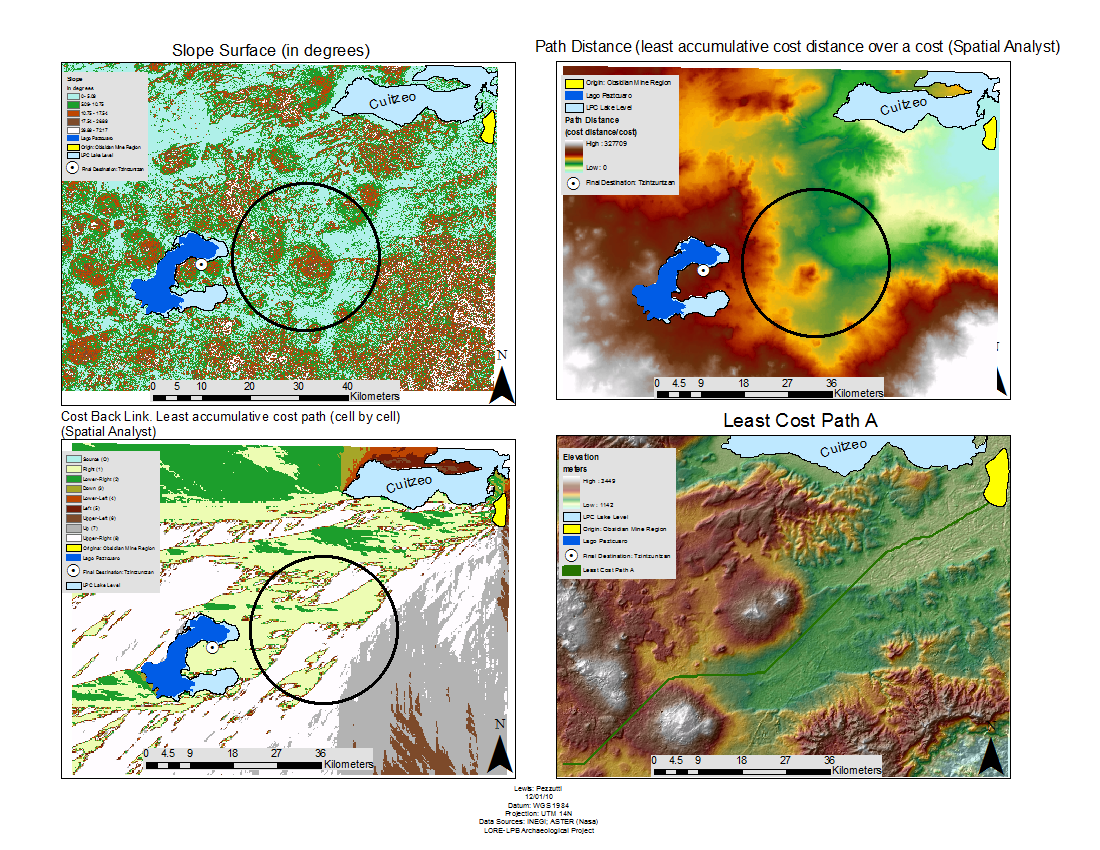
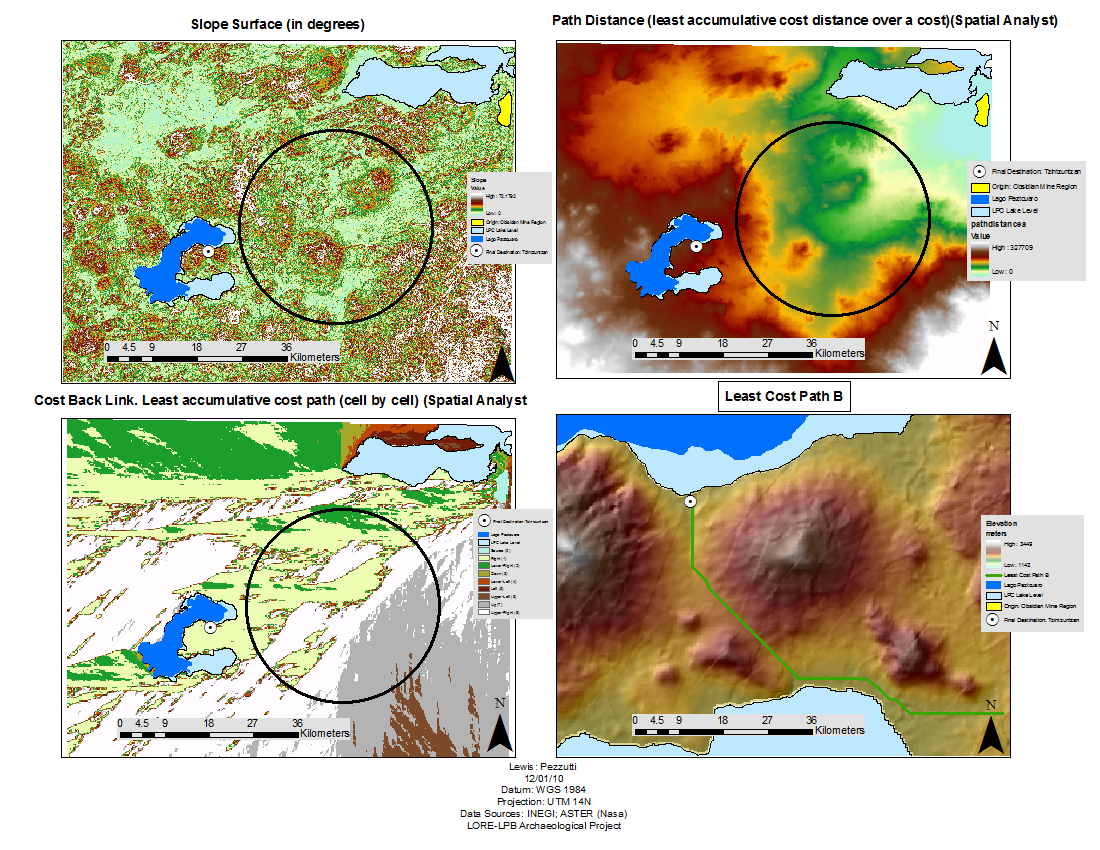
A least cost path analysis requires at a minimum the following data: origin, destination, cost surface, and back-link raster. The origin and destination can be composed of one or many source or destination cells. The cost surface represents the cost required to reach the origin from a given cell, and the back-link raster keeps track of the appropriate direction to move from a given cell (limited to 8 options of surrounding cells) in order to reach the closest orgin cell. Combining all this information allows for a least cost path to be calculated from the origin to the destination. The slope surface at both scales, represents a positive relationship that as slope grade increase, the energetic cost of crossing slopes increases as well. Thus, slope is considered a sensitive indicator of other important topographic aspects of long distance movements, such as cliffs or rugged topography (Field et al. 2007).
REGIONAL SCALE COST PATH
A “direct route” analysis from the eastern archaeological site of “ SA1 “ moving west to the capital of the Purepecha State and Empire, Tzintzuntzan. In order to reach this final destination, the route must pass through the recently discovered urban center of SA1. . For this analysis, this archaeological site is considered as an entry into the Lake Pátzcuaro Basin (core). This “direct Route” will only be used to employ a “wandering route” analysis (Field et al. 2007) to determine the most parsimonious route from the northeastern obsidian mines into SA1 archaeological site, and from there into the final destination, the capital of the Purépecha Empire: Tzintzuntzan
Notice: To protect the SA1 archaeological site from vandalism and looting, and to protect the integrity of Mexico's cultural resources, the exacat location of SA1 archaeological site is not given. Instead, a generalized regional location is circled in black.
LOCAL SCALE COST PATH
/LeastCostPathC.png)
by The JavaScript Source