Introduction
Location Map
Base Map
Database Schema
Conventions
GIS Analyses
Flowchart
GIS Concepts
Results
Conclusion
References
CONCLUSIONS
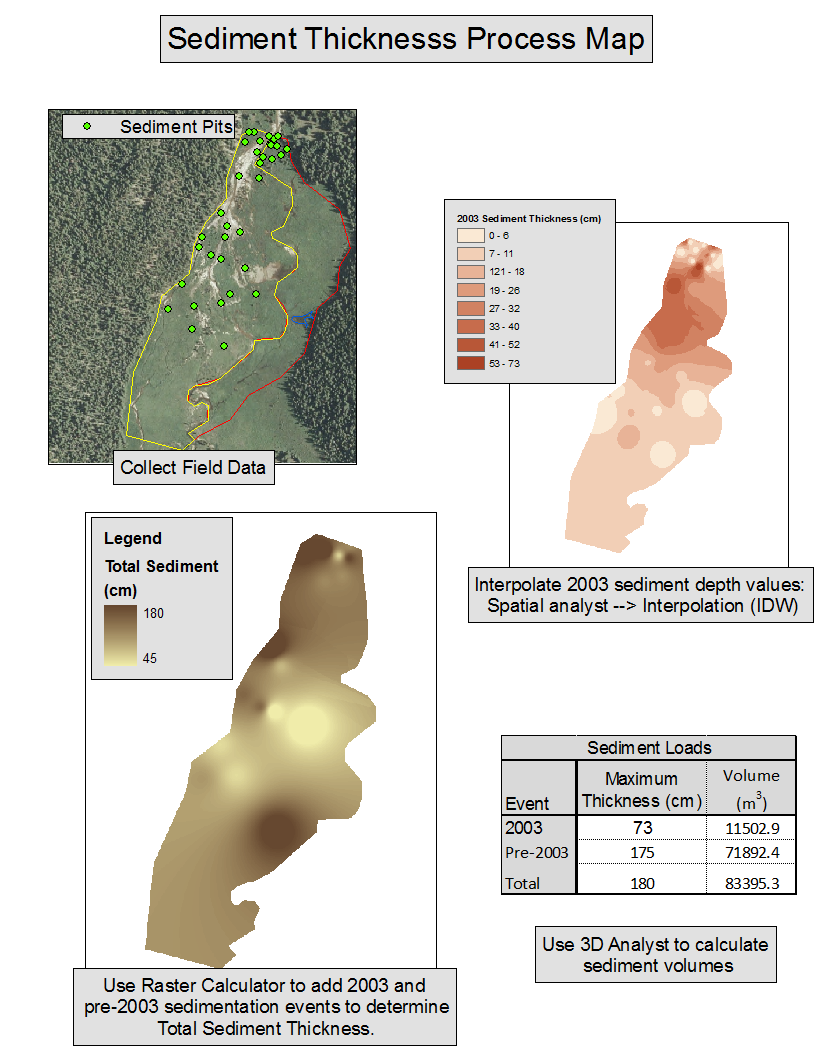
Our GIS analyses yielded a telling yet narrow perspective into riparian and wetland restoration. We analyzed sediment thickness measurements, interpolating point data to raster using IDW. Raster calculation results presented an approximation of 2003, pre-2003, and total sediment thicknesses (Figure 1).
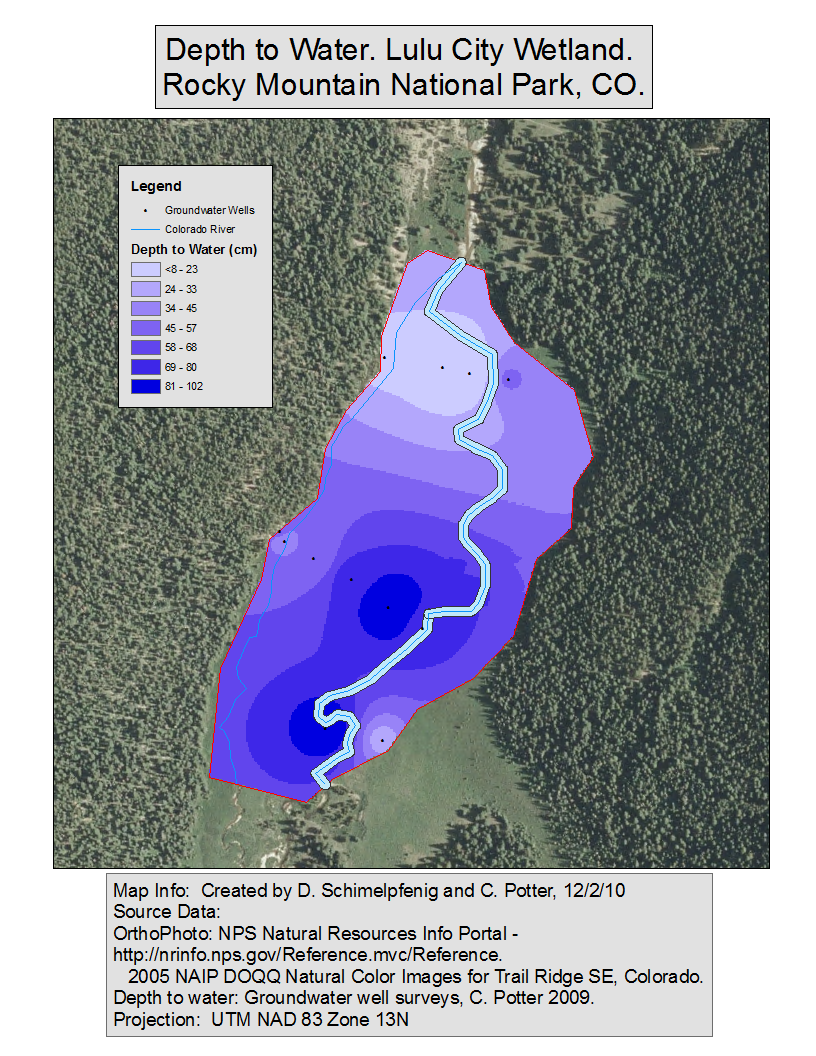
Depth to water calculations collected from groundwater well measurements were presented in a water table map providing a basis for current seasonal groundwater levels (Figure 2).
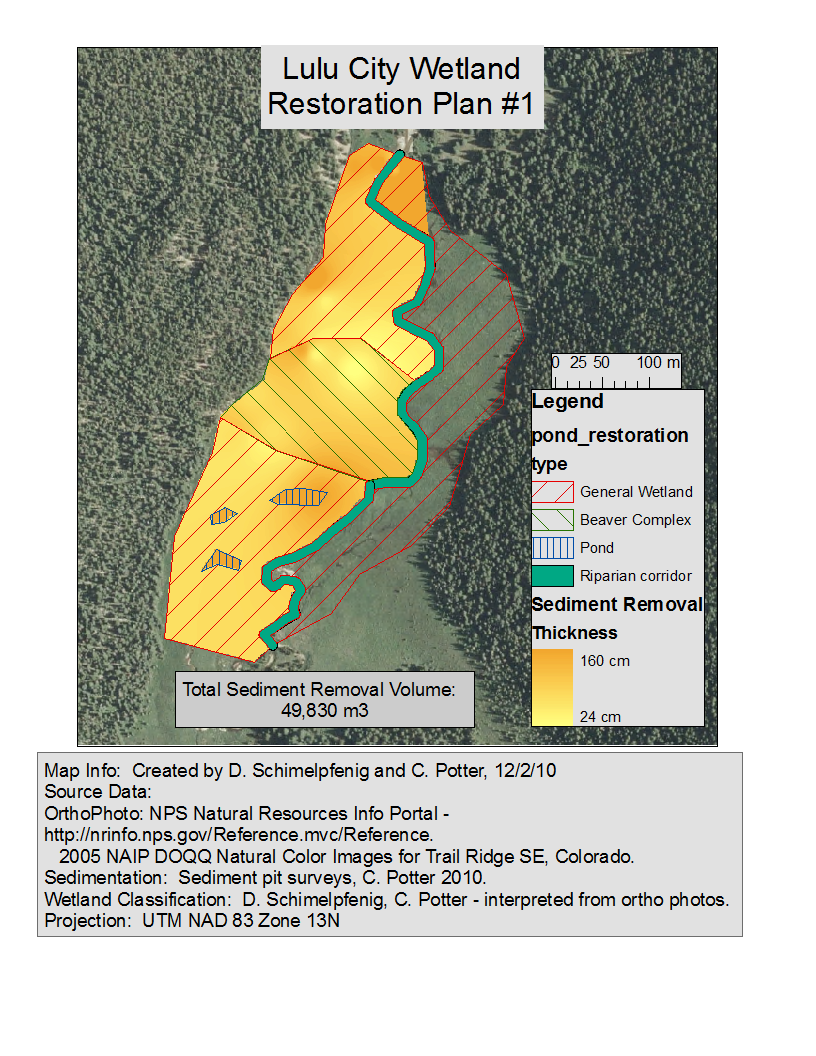
These data will be paired with our reference site water table data to compare degraded vs. pristine conditions. We used several analogous reference locations to determine appropriate vegetation community structure and wetland classification. Both our vegetation community structure and wetland classifications were categorized as Riparian, Wetland, and Beaver Complex; and were determined by spatial distribution of vegetation species and geomorphic wetland areas. These classifications were used to determine restoration protocol models (Figure 3).