Introduction
Location Map
Base Map
Database Schema
Conventions
GIS Analyses
Flowchart
GIS Concepts
Results
Conclusion
References
![]()
GIS Concepts
GIS Concepts
All information in this section is from resources.arcgis.com or help.arcgis.com.Select By Attributes
This function is used to select features in a layer using an attribute query, and is performed by using the Select By Attributes tool. This allows you to provide a query expression that is used to select features that match the selection criteria. This tool was utilized to select individual plots from the master shapefile, and to create shapefiles of the individual property boundaries from the shapefile containing all of the Boulder County Open Space properties.Clip
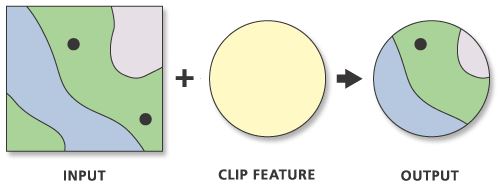
The Clip tool is used to cut out a piece of one feature class using one or more of the features in another feature class as a "cookie cutter." This is useful for creating a new feature class utilizing study area boundaries to contain a geographic subset of the features in another larger feature class. Clip features can be points, lines, or polygons, depending on the input features type.
Example from resources.arcgis.com:
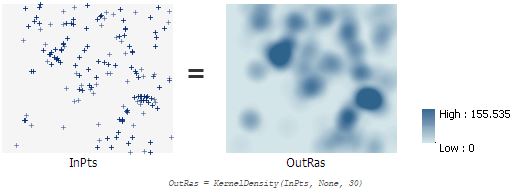
Kernel Density
The kernel density tool is in the spatial analyst toolbox, and calculates a magnitude per unit area from point features. It utilizes a kernel function to fit a smootly tapered surface to each point. Within this function, larger values of the search radius parameter produce a smoother, more generalized density raster, while smaller values produce a raster that shows more detail. This tool was utilized to create a density analysis of the amount of fires recorded in each study plot for each property.
Example from resources.arcgis.com:
This tool was utilized in the following manner:
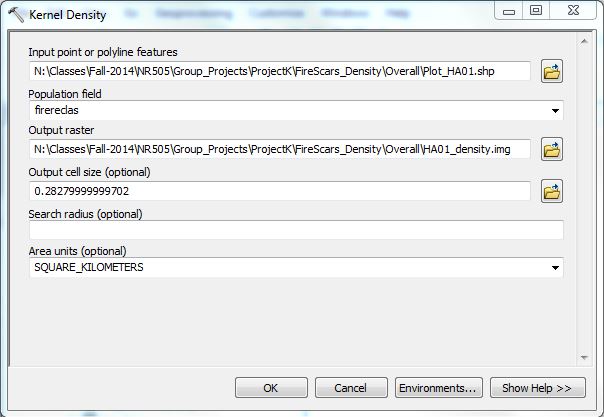
Densities were calculated based off of the "firereclas" field in the attribute table, where each fire year that was recorded on a plot was given a value of "1." The density of these "1" values within each plot resulted in the kernel density outputs for each plot.
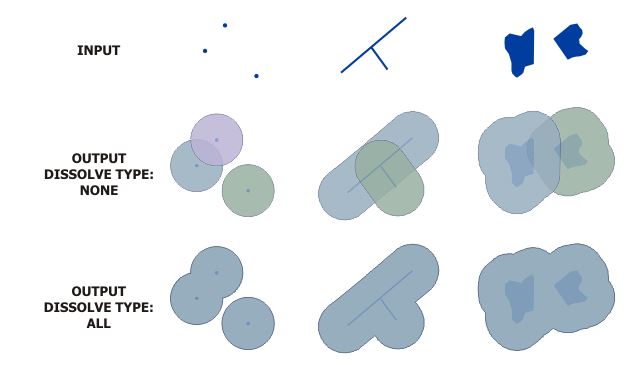
Buffer w/ Dissolve
This tool creates buffer polygons around input features to a specified distance. The "dissolve all" function within this tool creates larger polygons of intersecting buffers that will allow for canopy area calculations. Distortions due to projections can be avoided when buffering by using a feature class that has a geographic coordinate system and specifying a buffer distance in linear units. For our canopy analysis, we used a 3m buffer radius.
Example from resources.arcgis.com:
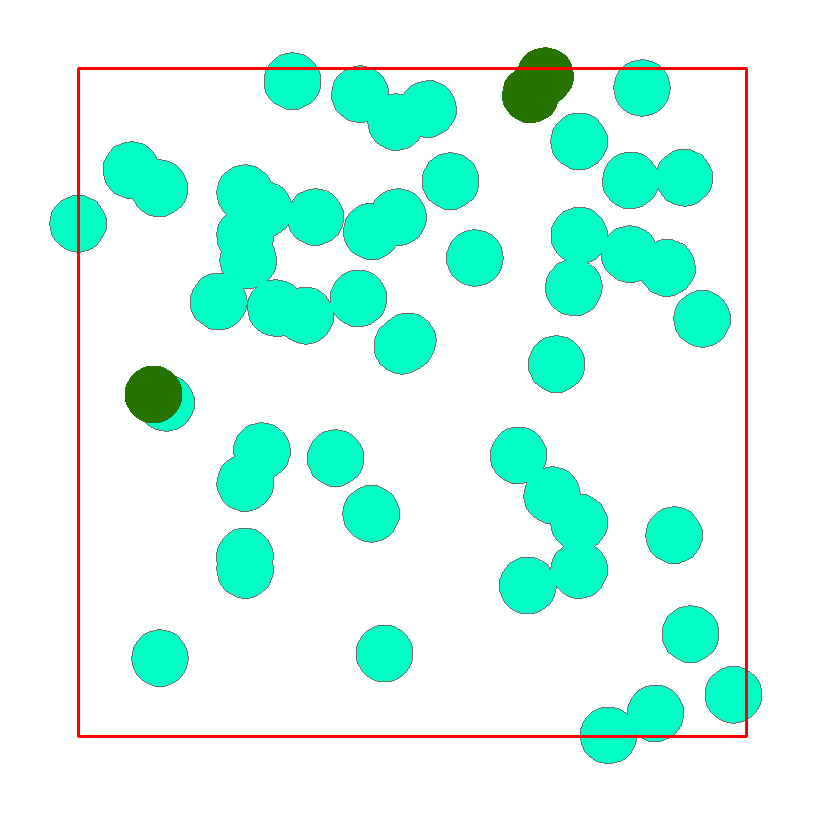
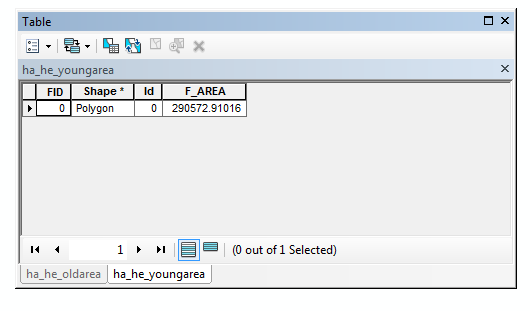
Calculate Areas
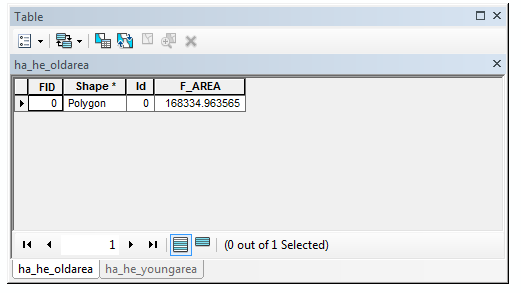
This was accomplished using the Calculate Geometry tool, which allows you to access the geometry of the features in a layer. Areas can only be calculated if the coordinate system being used is projected. It is recommended that an equal-area projection be used when calculating areas. From the created polygons using the previously mentioned buffer tool, areas were calculated in square meters for both old-tree canopy areas and young-tree canopy areas.
Example from this project:
Old trees are represented by the dark green buffered areas, while yound trees are represented by the light green.
Hillshade
This tool creates a shaded relief from a surface raster by considering the illumination source angle and shadows. The analysis of shadows is done by considering the effects of the local horizon at each cell, and raster cells in shadow are assigned a value of zero. The input raster used in this analysis was a digital elevation model downloaded from the USGS.Extract by Mask
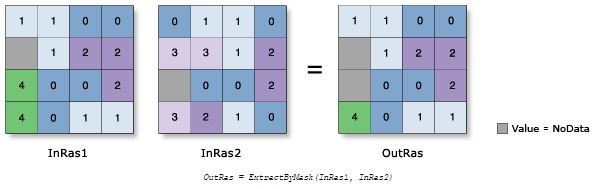
This tool extracts the cells of a raster that correspond to the areas defined by a mask. This is similar to the Clip tool that is used for feature classes, but the extract by mask tool only works on raster datasets.
Example from help.arcgis.com:
Slope
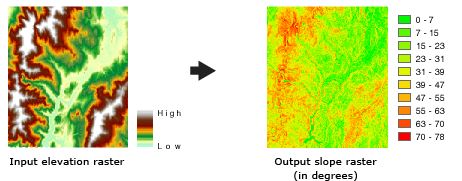
For each cell in a raster dataset, the Slope tool calculates the maximum rate of change in value from that cell to its neighbors. The maximum change in elevation over the distance between the cell and its 8 neighbors identifies the steepest downhill descent from the cell. Conceptually, the tool fits a plane to the z-values of a 3x3 cell neighborhood around the processing or center cell. The lower the slope value, the flatter the terrain; and the higher the slope value, the steeper the terrain. The output slope raster can be calculated in 2 types of units, degrees or percent rise, and for this analysis we used percent rise. The Slope tool is most frequently run on an elevation dataset, and for this analysis we utilized the digital elevation model to calculate slope.
Example from resources.arcgis.com:
Euclidean Distance
This spatial analyst tool calculates the Euclidean distance for each cell to the closest source. The input data source can be a feature class or a raster dataset. When the input data source is a feature class, the source locations are converted internally to a raster before performing the analysis. When the input data source is a raster, the set of source cells consists of all cells in the source raster that have valid values.
Reclassify
This spatial analyst tool reclassifies or changes the values in a raster dataset. The input raster must have valid statistics, and if they do not exist they can be created using the Calculate Statistics tool in the Data Management Tools toolbox. This tool was utilized in the least cost path analysis to assign subjective values to each aspect of the cost analysis. This was used to apply a gradient of values based on difficulty to access certain areas based off of slope, distance to roads, and distance to streams. The reclassifications of data layers for our project are described in detail in the 'GIS Analysis' section.Raster Calculator
The Raster Calculator tool allows you to create and execute map algebra expressions in a tool, and is specifically designed to implement single-line algebraic expressions and use multiple spatial analyst tools in a single expression.
Example from our Cost Analysis section:
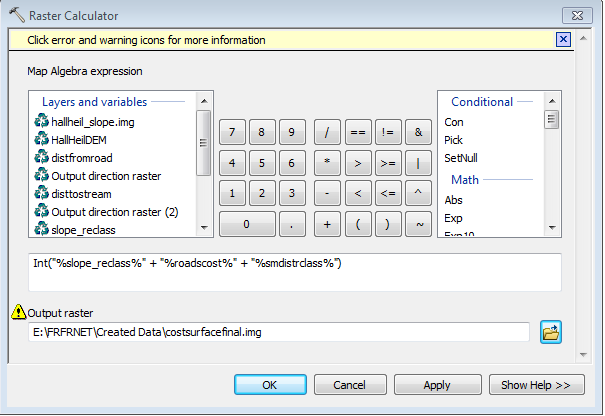
The input layers and variables list identifies the input that can be used in the map algebra expression. The calculator buttons allow you to enter the numeric values into the expression, and the operator buttons allow you to enter mathematical and logical operators into the expression. The tool list is a convenient selection of tools that can be used in the map algebra expression.
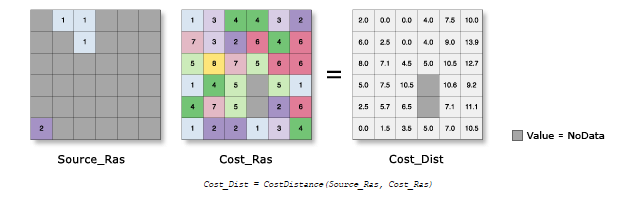
Cost Distance
The Cost Distance tools allow you to determine the least costly path to reach a source for each cell location in the analysis window within a raster dataset. The least accumulative cost path to a source, the source that allows for the leat-cost path, and the least-cost path itself must be determined for each cell. All cost distance tools require both a source dataset and a cost raster as input.
Example from resources.arcgis.com: