
Introduction
Location Map
Base Map
Database Schema
Conventions
GIS Analyses
Flowchart
GIS Concepts
Results
Conclusion
References
![]()
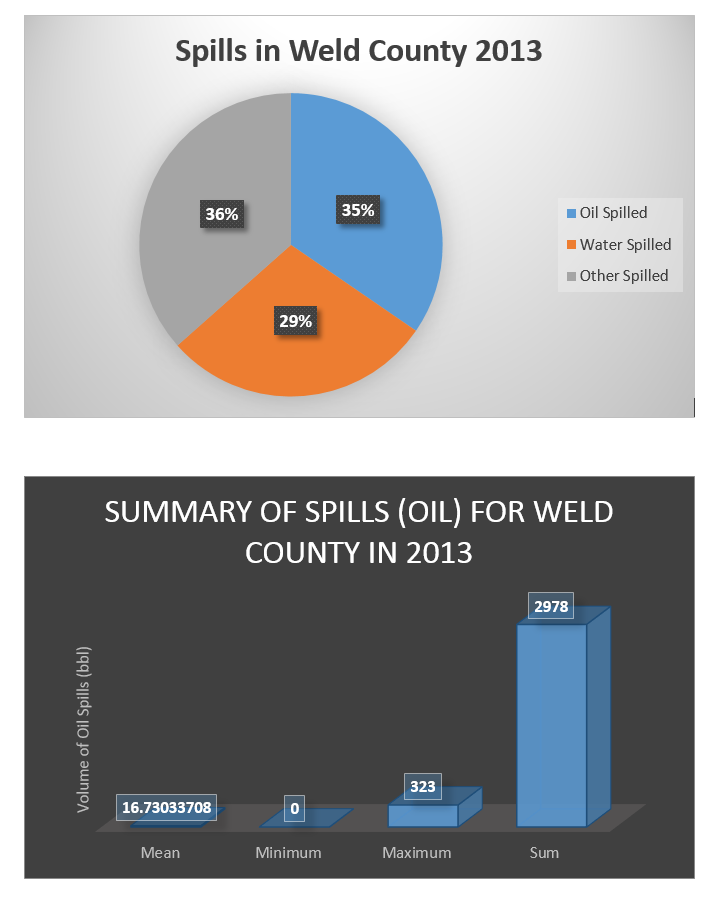
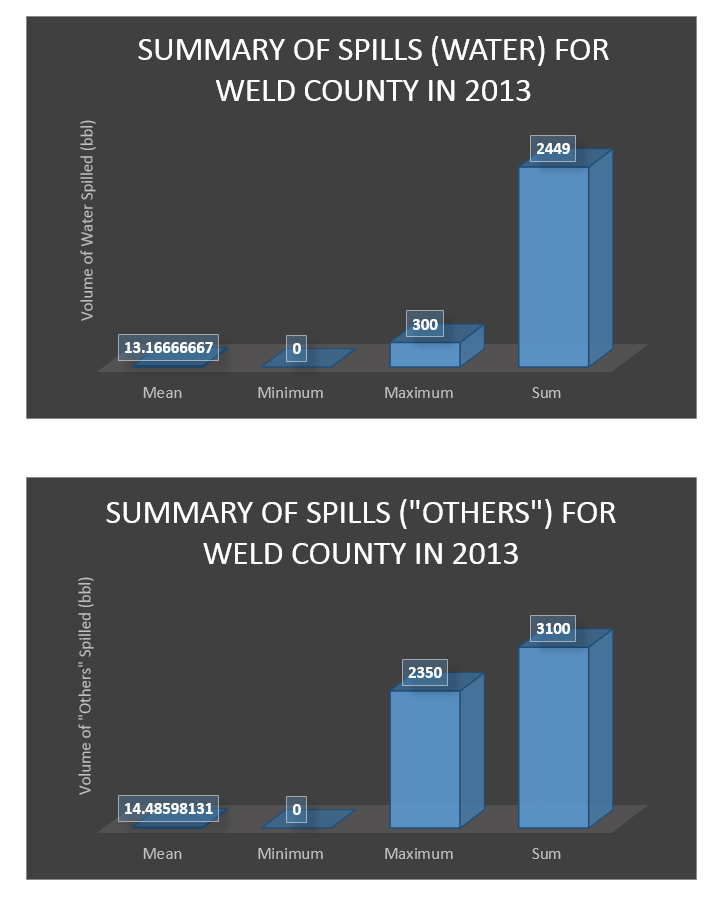
Results
Results
Buffer Area |
Oil Spilled |
Water Spilled |
Otherspilled |
All Spills |
Streams |
1889 |
1132 |
96 |
3117 |
Water bodies |
1723 |
937 |
159 |
2819 |
Total |
3612 |
2069 |
255 |
5936 |
Average Nearest Neighbor Results Summary
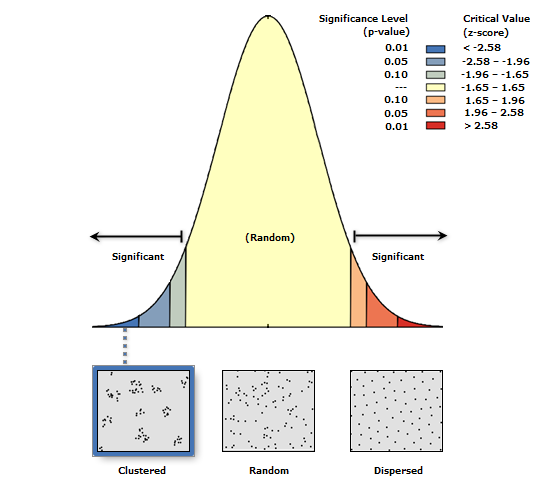
Observed Mean Distance: |
1762.7025 Meters |
Expected Mean Distance: |
2881.1013 Meters |
Nearest Neighbor Ratio: |
0.611816 |
z-score: |
-13.075247 |
p-value: |
0.000000 |
Given the z-score of -13.0752466739, there is a less than 1% likelihood that this clustered pattern could be the result of random chance.