Introduction
Location Map
Base Map
Database Schema
Conventions
GIS Analyses
Flowchart
GIS Concepts
Results
Conclusion
References
![]()
GIS Concepts
GIS Concepts
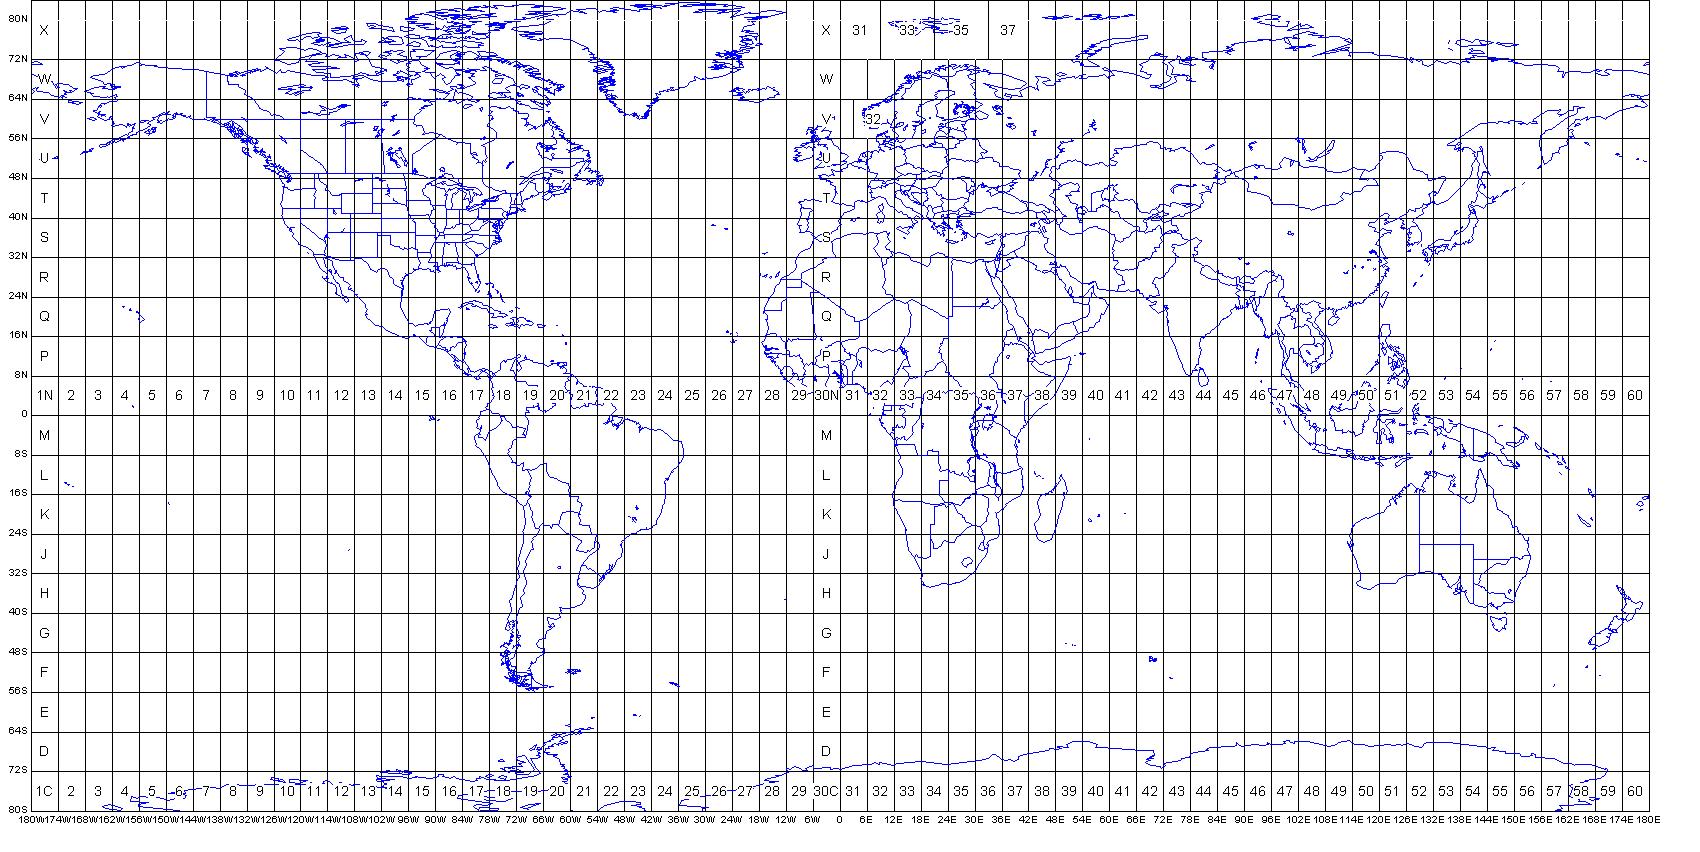
Projection
A map projection is a process that allows us to display the curved surface of the earth on a flat surface. One of the first steps in working with GIS data is to ensure that all of the data is projected to the same coordinate system so that all files aligned spatially. This is imperative for data and mapping accuracy. For this research, we projected our data to NAD 1983 UTM Zone 13.
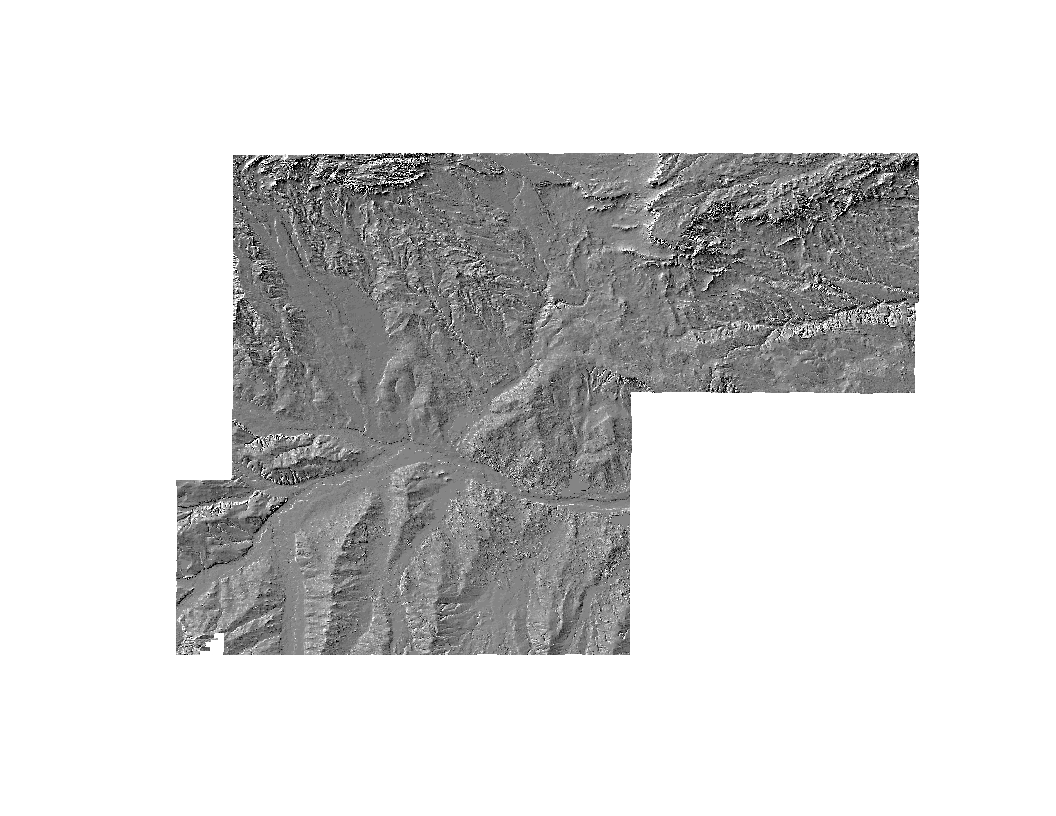
Hillshade
A hillshade represents the way that land is illuminated on the earth's surface based on a particular geographic position of the sun (specifically the azimuth and altitude for the sun). It provides maps with a 3-D effect by drawing shadows on the terrain based on the sun's positionality.
Here, we used the DEM raster to create hillshading across Weld county, Colorado.
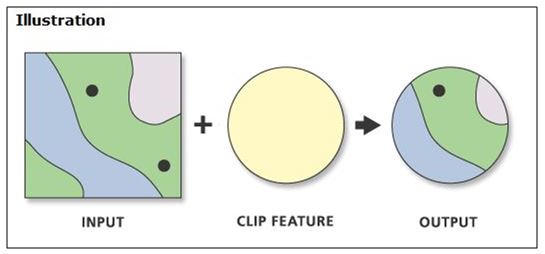
Clip
The clip tool is very useful in mapping. It allows a user to take features from one feature class, and limit them to an existing boundary on another feature class. For this project, we utilized this took to clip the streams and waterbodies to Weld County. The spill data was already selected for Weld County only, so it was not necessary to clip spill points to the Weld County boundary lines.
Buffer
The buffer tool creates a polygon shape that expands to a selected distance around an input feature. For this project, we created a 500-foot buffer around streams and waterbodies, which was used to analyze spills which were within that 500-foot buffer. We also created a 500-foot buffer around spills, but relied on the stream and waterbodies buffers for our analysis at this point.
Intersect
The intersect tool allows a user to determine where input features overlap with one another. We used this tool to identify spills that occurred within 500 feet of a stream or waterbody.
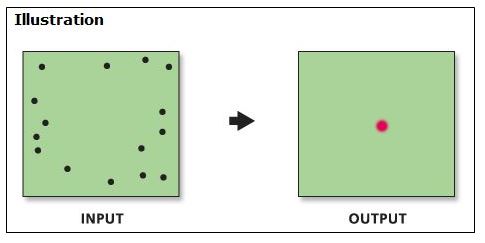
Geographic Mean Center
The Geographic Mean Center is a spatial statistic tool which essentially allows a user to find the average geographic location of a collection of x,y coordinates. It is represented by a single x,y coordinate point. We used this tool to show where the average location of 2013 oil and gas spills in Weld County would be located.
Fill Sinks
The fill sinks spatial analyst tool is useful for hydrologic analysis, it is used to fill out sinks in DEMs in order to reduce errors in the data.
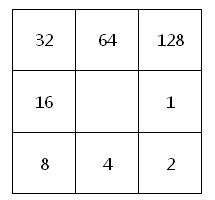
Flow Direction
This spatial analyst tool identifies the flow of water on the raster surface. Cells are coded as 1, 2, 4, 8, 16, 32, 64, and 128 and represent the direction of water flow for example 64 means that the water is flowing to the north.
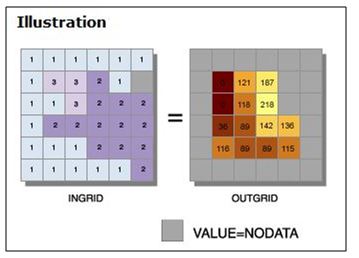
Flow Accumulation
This spatial analyst tool creates a network of accumulated flows for the surface cells fdf
Flow length
This tool calculates the upstream or downstream distance along the flow path for each cell. It can either be upstream or downstream analyses.
Watershed
This identifies the contributing stream area above a set of cells in the raster.
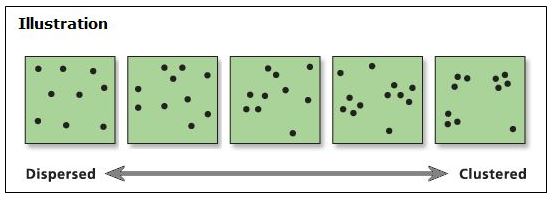
Average Nearest Neighbor (ANN)
The ANN is a spatial statistic which creates a nearest neighbor index by determining the average distance from every feature to the feature nearest to it. For this project, we used this analysis to calculate the ANN for the spill locations.