Introduction
Location Map
Base Map
Database Schema
Conventions
GIS Analyses
Flowchart
GIS Concepts
Results
Conclusion
References
Results
Vector Analysis Output

Click on Image to Enlarge
Summary of Stand Management Acreages |
|||||
Stand Access |
Class |
Priority |
Mean Slope |
||
< 25% |
25% - 35% |
> 35% |
|||
Roads |
5 |
1 |
2,548 |
0 |
0 |
4 |
2 |
4,872 |
33 |
39 |
|
3 |
3 |
3,367 |
6 |
9 |
|
2 & 1 |
4 |
13,785 |
10 |
113 |
|
Rec Sites |
All |
1 |
Included in road access acreage |
||
Trails Only |
5 |
1 |
0 |
||
4 |
2 |
1 |
|||
3 |
3 |
301 |
|||
2 & 1 |
4 |
345 |
|||
Total |
25,429 |
||||
Raster Analysis for Stand-based Output
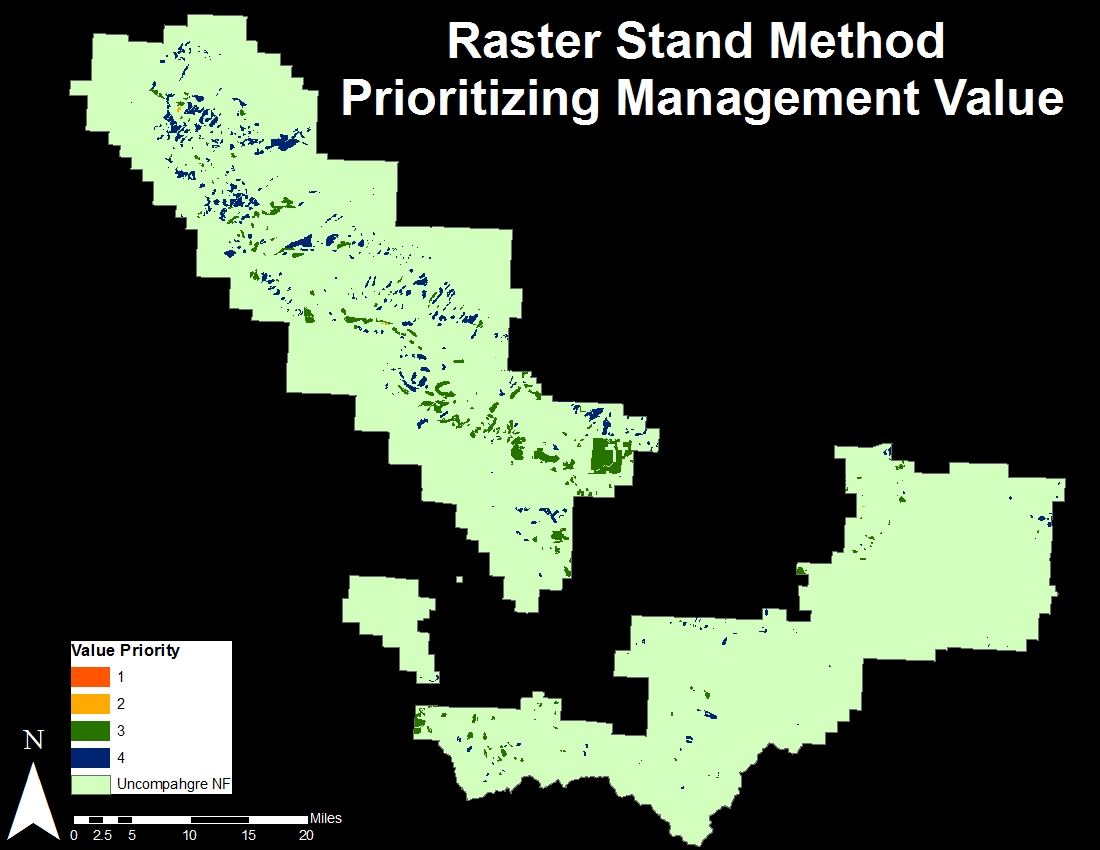
Click on Image to Enlarge
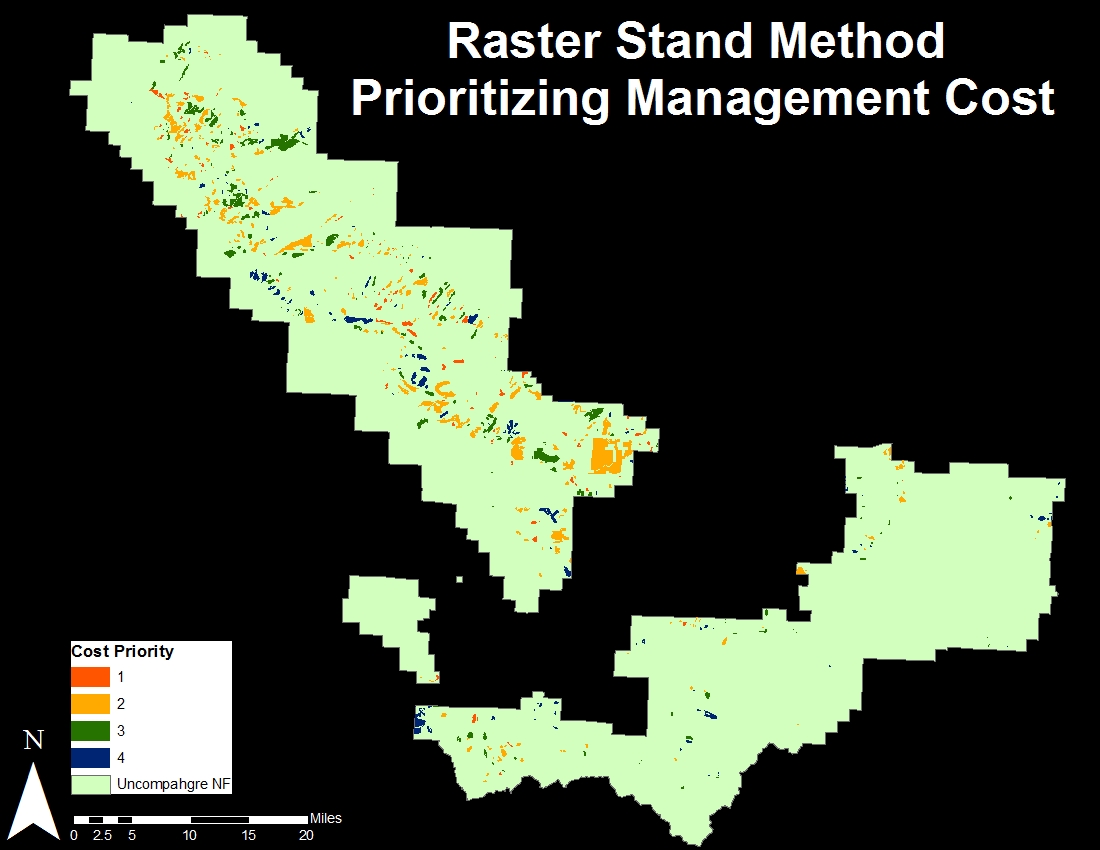
Click on Image to Enlarge
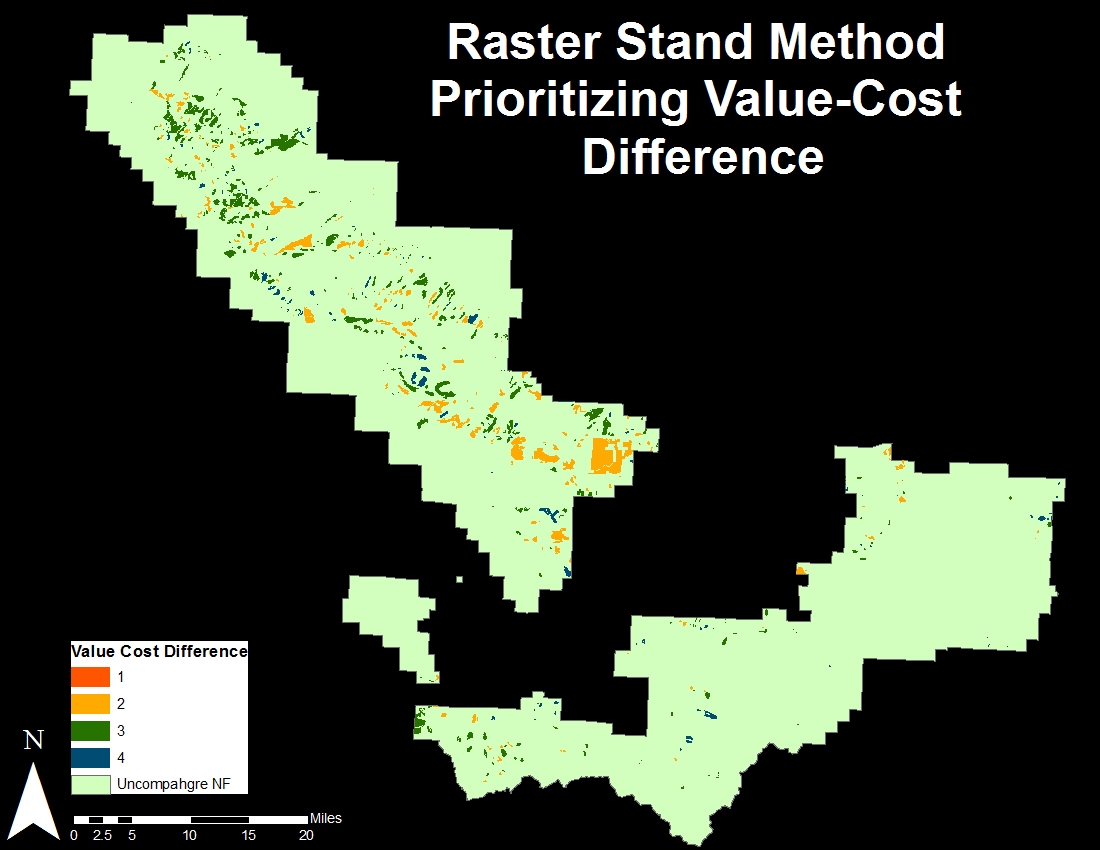
Click on Image to Enlarge
Raster Analysis for Pixel-based Output
![]()
Click on Image to Enlarge
![]()
Click on Image to Enlarge
![]()
Click on Image to Enlarge
Comparison of Raster Analysis for Pixel-based Output with other methods
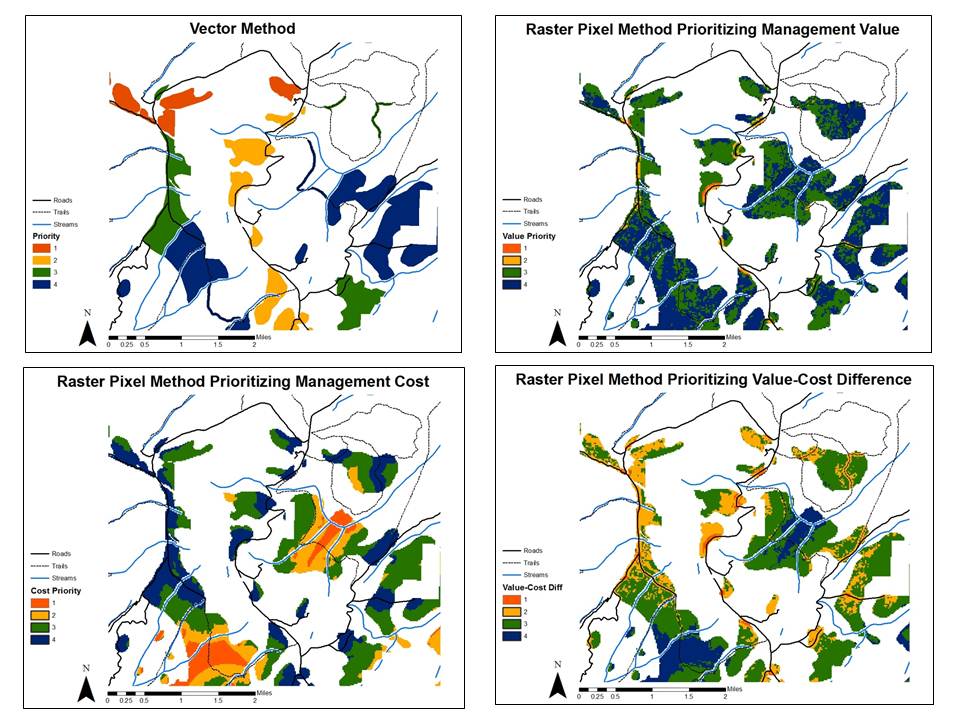
Click on Image to Enlarge
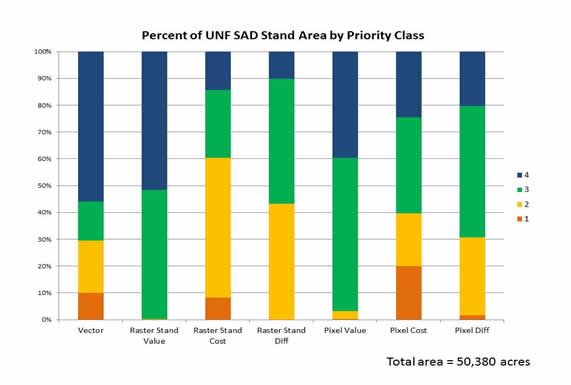
Summary of Priority Class Breakdown
Table 1: The proportion of the SAD affected landscape classified by management priority class by different methods.
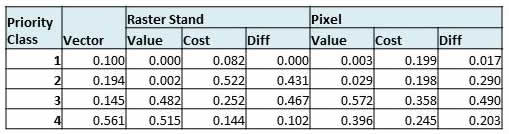
Graph 1: The proportion of the SAD affected landscape classified by management priority class by different methods. Color scheme matches maps.