
Introduction
Location Map
Base Map
Database Schema
Conventions
GIS Analyses
Flowchart
GIS Concepts
Results
Conclusion
References
Sudden Aspen Decline Management in the Uncompahgre National Forest
Our goal is to create a management prioritization plan for areas within the Uncompahgre National Forest (UNF) that are affected by sudden aspen decline (SAD). The UNF has a variety of management goals, including timber production, conservation, and recreation access. Stands affected by SAD require management because aspen regeneration is typically low (Worrall et al. 2008). The sudden and massive die-off of aspen has resulted in large areas with no live canopy cover and little regeneration.
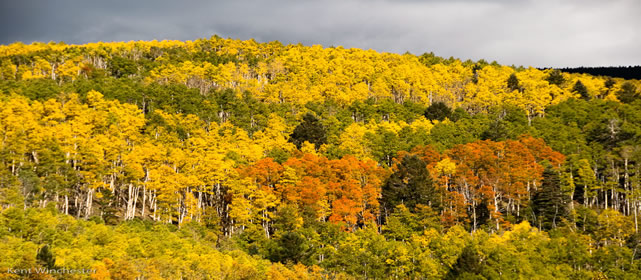
Aspen stands are valued in southwest Colorado. Aspen are important for the local wood products industry. Native ungulate populations feed on aspen suckers to survive harsh winters. Aspen are also important successional species that create microclimate conditions for later establishment of shade-tolerant conifers. Little is known about how SAD could affect forest stand and landscape dynamics. Tourism and recreation are important economic drivers for southwest Colorado. Aspen viewing is a popular fall activity that brings in big tourism dollars. Recreation can also be negatively impacted by dead trees near roads and trails that have potential to fall on trail users or cause travel impedances.
We aim to explore various methods for prioritizing management efforts based on both the value and cost of management. This project will be split in two based on diverging methodologies and base data structures. The first part will be a vector-based analysis using only readily-available vector data layers and simple zonal statistics from a digital elevation model (DEM). The second part will be an in-depth raster-based analysis that aims to provide a flexible framework for management priority development.
Part 1: Vector Analysis
Vector analysis will explore methods for treating areas affected by SAD based on the level of development of various recreation features. The focus of this analysis will be on increasing recreation user safety in the UNF. Data structures are comprised of point, polyline and polygon layers which can be easily queried and manipulated using basic extraction, overlay and proximity tools. A percent slope grid was utilized through zonal statistics to determine stand slope averages.
While vector formats are a somewhat rigid spatial representation, the format is easy to work with for beginner and intermediate users and qualitative data is easily displayed and edited. Management priorities can be easily identified by determining where recreation infrastructure intersects SAD impacted stands and assigning values based on qualitative attributes.
Part 2: Raster Analysis
This portion of the project will explore a methodology for evaluation of management importance and management costs for areas affected by SAD within the UNF. The raster analysis will involve three ways of evaluating management priorities: management value, management cost, and management value-cost difference. The management value will be determined by three criteria: 1) user safety and roadways management value, 2) aesthetic value, and 3) ecological value. The management cost will be determined by two criteria: 1) access (as a function from either distance from roads or distance from trails) and 2) slope-based management costs.
The raster analysis system is flexible. The land manager can add to the data sources used, including inputs for both management value and management costs. The outputs can also be rescaled or reclassified as needed. Raster outputs can be used for either pixel-based priority rankings or for stand-based priority rankings through summary statistics.