
Introduction
Location Map
Base Map
Database Schema
Conventions
GIS Analyses
Flowchart
GIS Concepts
Results
Conclusion
References
Using GIS to Determine Native Felid Habitat in Urbanizing Areas and its Link to Human and Domestic Cat Conflicts
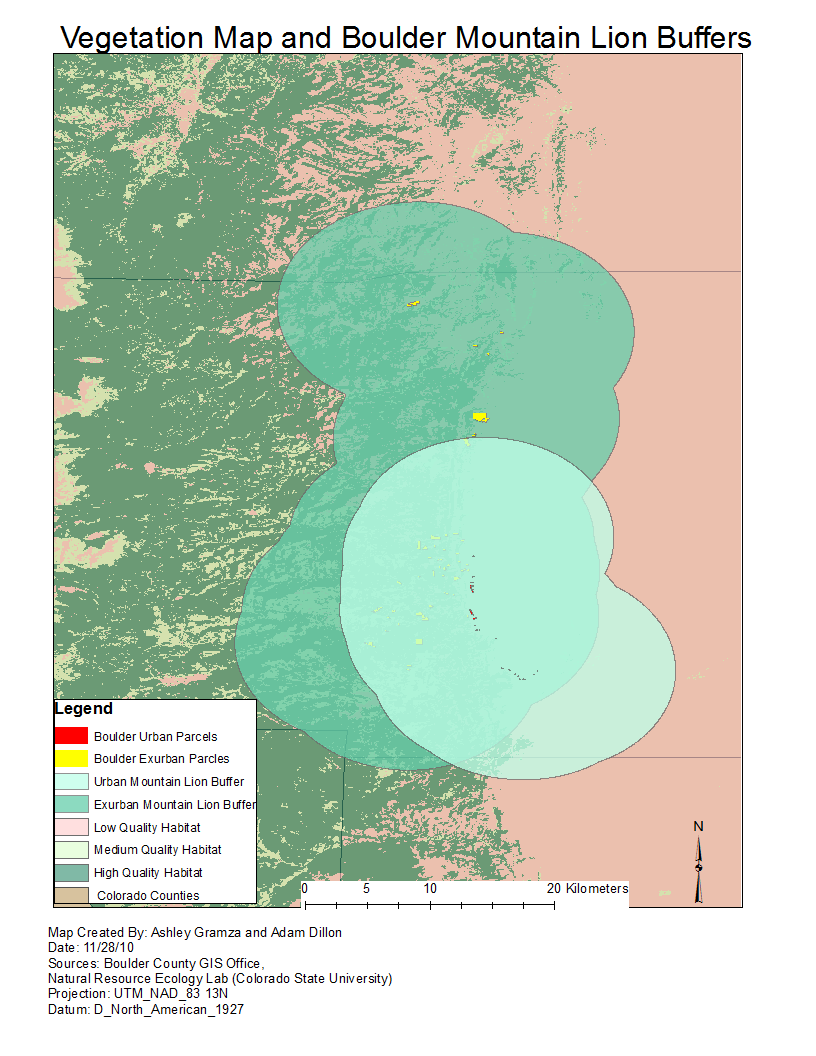
Basemap
The base map below represents mountain lion home range buffers surrounding both urban and exurban parcels in the Boulder study area. Below the buffers you can see the habitat characteristics used to determine suitability. Later, you will see how we used raster calculator to calculate the percentage of suitable habitat within the mountain lion buffers (by parcel and by level of urbanization). We also created bobcat home range buffers for both levels of urbanization within the Boulder study area, and we created bobcat and mountain lion buffers for both UP levels of urbanization.
The base map below represents domestic cat home range buffers surrounding selected Boulder exurban parcels. Below the buffers you can see the bobcat suitability vegetation layer. We calculated percent of each level of bobcat habitat suitability that occurred within each domestic cat home range (by parcel) and used this as a proxy for bobcat-domestic cat interaction risk. This interaction risk data can then be compared to resident risk perceptions at each individual parcel. We chose 5 parcels from each study area and level of urbanization (Boulder urban, Boulder exurban, UP urban, UP exurban). We then determined the percent of suitable bobcat and mountain lion habitat (2 analyses) within each domestic cat home range by parcel and by level of urbanization (separately).
