Introduction
Location Map
Base Map
Database Schema
Conventions
GIS Analyses
Flowchart
GIS Concepts
Results
Conclusion
References
![]()
Results
Results
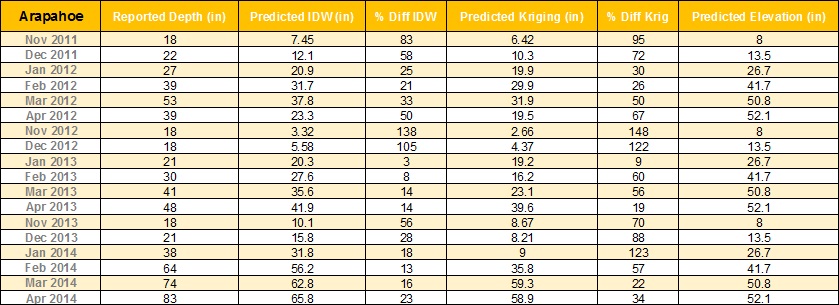
Predicted snow depths using Inverse Distance Weighting, Kriging, and Elevation analysis are summarized for each resort below. We show reported depths, predicted depths, and the percent difference of reported versus predicted for each of the 5 ski resorts in our study.
The ski resorts had a tendency to over-report snow depth compared with the numbers calculated using the statistical methods. The below figures show the interpolation maps created for January 2014, one of the months with the smallest percent difference in reported and predicted values for all five ski resorts (i.e. the most accurate prediction). The only exception was Arapahoe Basin, where January 2013 had the smallest difference.
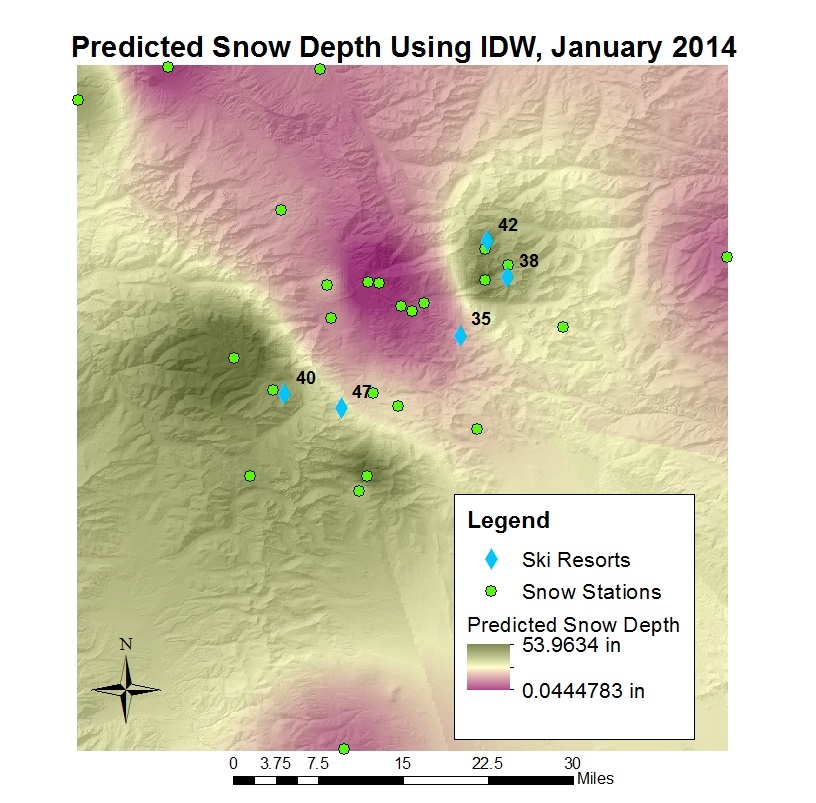
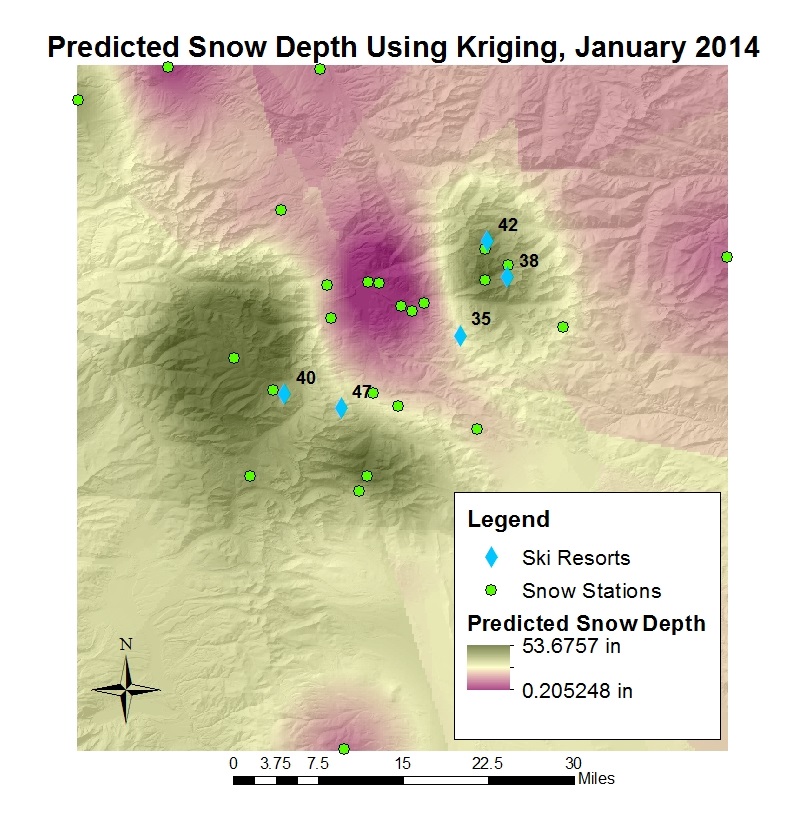
Figures 1 and 2: Predicted snow depths using Inverse Distance Weighting (left) and Kriging (right). The numbers correspond to the reported snow depths at each of the ski resorts. Most of the ski resorts are relatively close to the predicted values, with the exception of Keystone.
November and December typically had the least agreement between the snow depths. However, this difference is likely because resorts made snow early in the season. According to Breckenridge’s website, industry standards mandate a reported snow depth of 18 inches (which was most often reported for November and December) “when the majority of skiable terrain is on manmade snow” (Breckenridge FAQ). Besides these months, April 2012 had the largest percent differences, with prediction maps seen below.
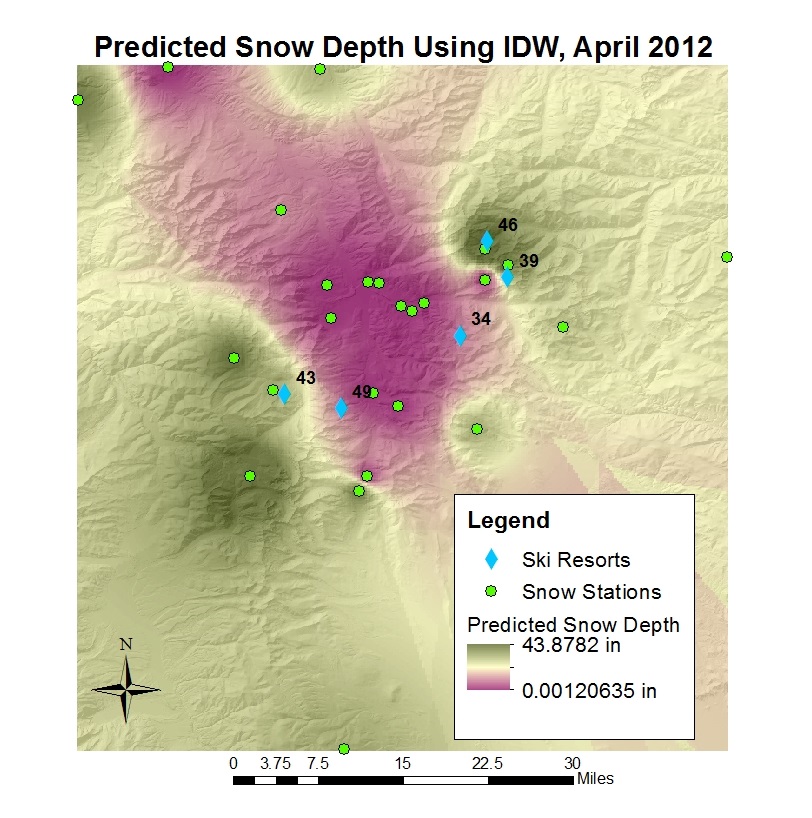
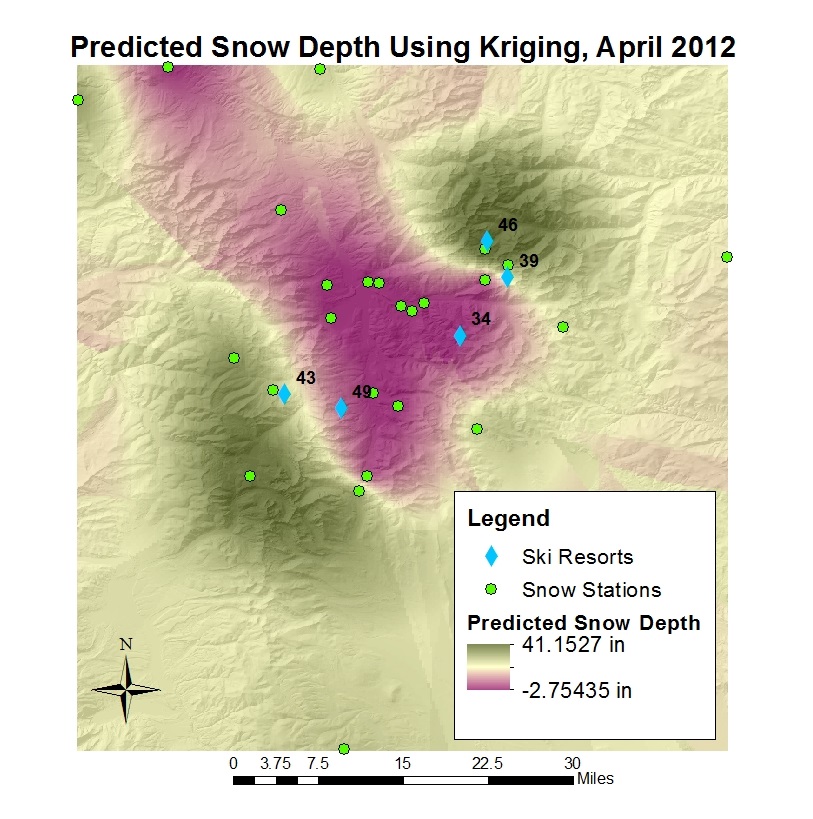
Figures 3 and 4: Predicted snow depths using Inverse Distance Weighting (left) and Kriging (right). The numbers correspond to the reported snow depths at each of the ski resorts. Most of the ski resorts reported depths greater than the predicted. Loveland had the smallest percent difference, with 12% for both IDW and Kriging. However, the other resorts had upwards of 50%. Keystone was the worst with a difference of 143% and 190% for IDW and Kriging, respectively.
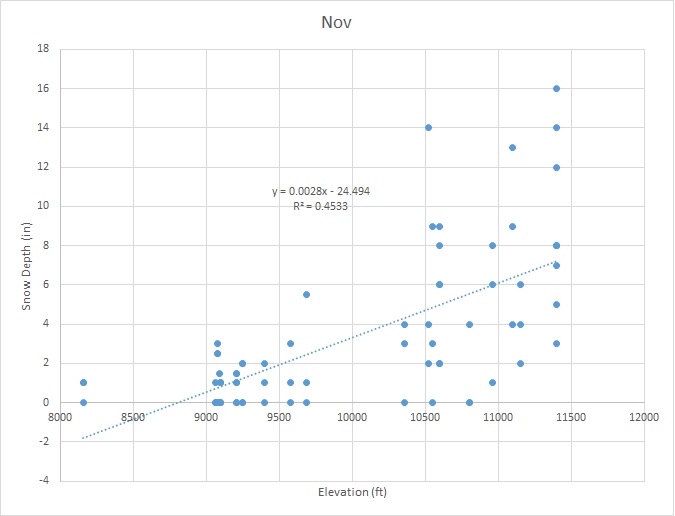
Snow depths were also predicted with elevation regressions, using Microsoft Excel. The predictive power of just elevation was somewhat lacking, with correlation (R-squared) values of 0.45 and below for different months. Generally, the elevation predictions were closer to the reported values mid-season (January and February) than at the start or end of the seasons. A sample elevation regressions is shown below.