Introduction
Location Map
Base Map
Database Schema
Conventions
GIS Analyses
Flowchart
GIS Concepts
Results
Conclusion
References
![]()
GIS Analyses
In order to examine the spatial variability of snowpack in Summit County, Colorado and determine the accuracy of ski resort snow depth reporting, we utilized a number of different public sources. The steps to acquire, prepare, and analyze the data are detailed below.
Data Acquisition
For each of the sources below, we acquired snow depth data on the first day of the month for the winters (November-April) of 2011-2012, 2012-2013, and 2013-2014.
SNOTEL
The Natural Resources Conservation Service (NRCS) installs, operates and maintains an extensive, automated system called SNOTEL (short for Snow Telemetry). SNOTEL is designed to collect snowpack and related climatic data in the Western U.S. and Alaska. We collected data from 12 SNOTEL stations in Summit County and prepared this data to import as points into ArcGIS.
Snow Courses
A snow course is a permanent site that represents snowpack conditions at a given elevation in a given area. These are also operated by the NRCS and are sampled manually on or near the first of every month during the snowpack season. Generally, the courses are about 1,000 feet long and are situated in small meadows protected from the wind. We used data from 3 snow courses as additional points for our analysis.
Weather Stations
The Global Historical Climatology Network - Daily (GHCN-Daily) dataset integrates daily climate observations from approximately 30 different data sources, including snowfall and snow depth. Data from these stations are available from the National Climatic Data Center (http://www.ncdc.noaa.gov). We used data from 6 GHCN stations.
CoCoRaHS
CoCoRaHS, the Community Collaborative Rain, Hail, and Snow Network, is a grassroots volunteer network of backyard weather observers working together to measure and map precipitation (rain, hail and snow) in their local communities. Although these are not professional observers, the system has high quality standards and an effective training program and provided us with 8 additional snow depth points for our analyses.
DEM
Digital elevation model data is critical to this project so that snow depths can be interpolated across our area of interest. This data was downloaded from the U.S. Geological Survey’s National Map Viewer, a clearinghouse for topographic base map data and products (http://nationalmap.gov/viewer.html).
Data Preparation
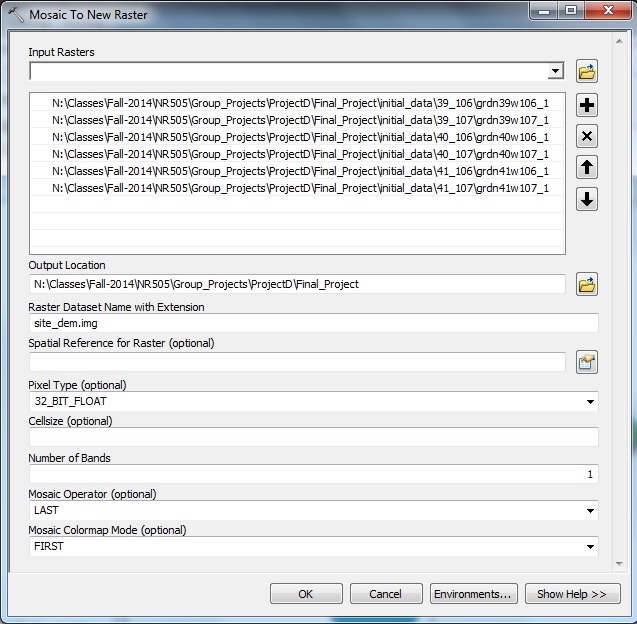
DEM files for the area were stitched together using the mosaic to new raster tool.
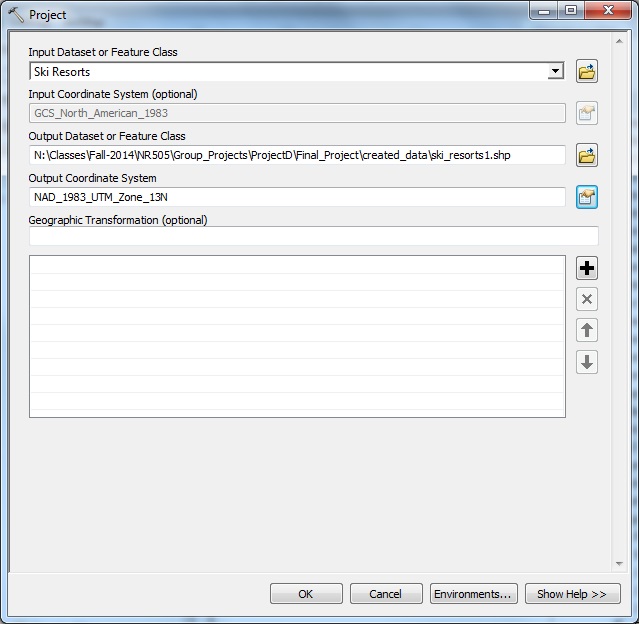
Different files used in this project had different coordinate systems. In order to have a uniform coordinate system, we used "Define Projection" tool and projected all files to NAD 1983 UTM Zone 13N.
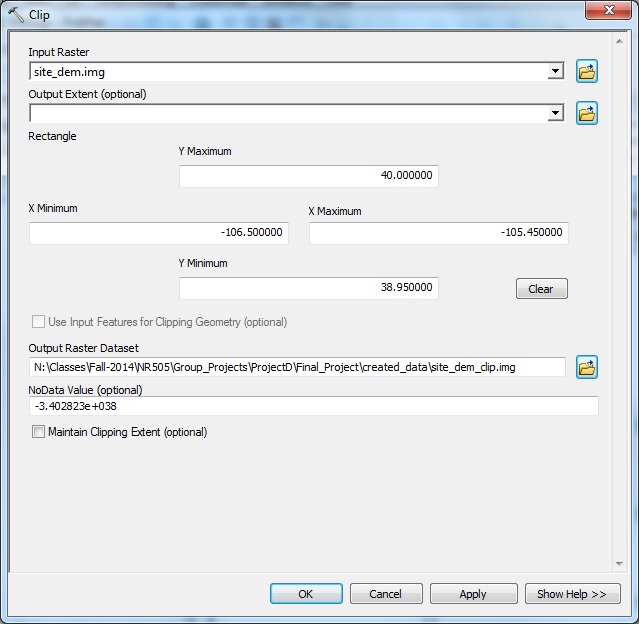
We clipped our DEM to a defined study area, showing most of Summit County and the surrounding country. We did not clip just to the Summit County boundary because a few of our snow depth data points were just outside of the boundary.
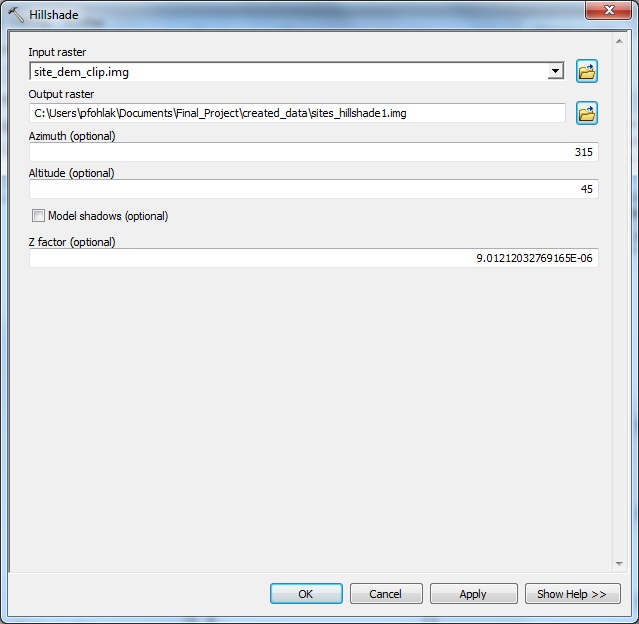
We created a hillshade for the mosaicked DEM file using the hillshade tool
- Selected the mosaicked DEM as the input raster
- Saved the file with a .img extension so we were not restricted to 13 characters
Data Analysis
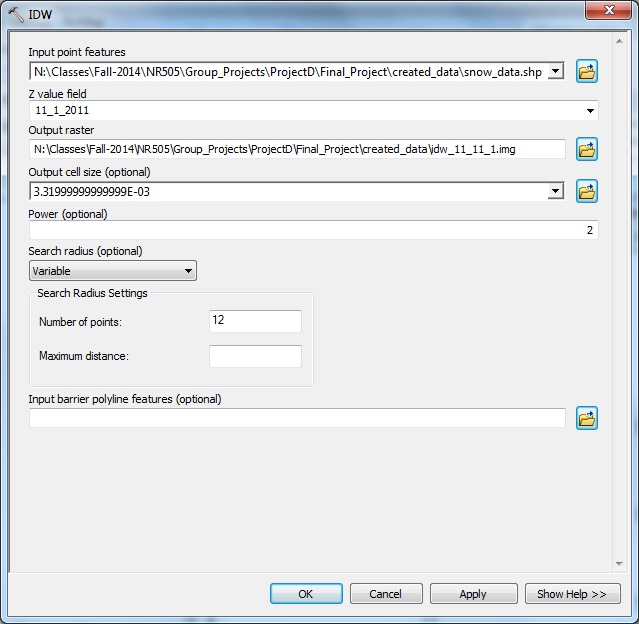
In order to determine the accuracy of ski resort snow reports, we needed to interpolate our point data across Summit County.We first used the inverse distance weighting (IDW) tool from the spatial analyst toolset.
- Selected the accumulated point data as the input point features
- Selected the snow depth for the first month (Nov 2011) as the z (magnitude) field
- Ran the tool 18 times (once for every month) to yield rasters for every snow month during our three year analysis period. This process is simplified by using a model (shown in the flowchart section)
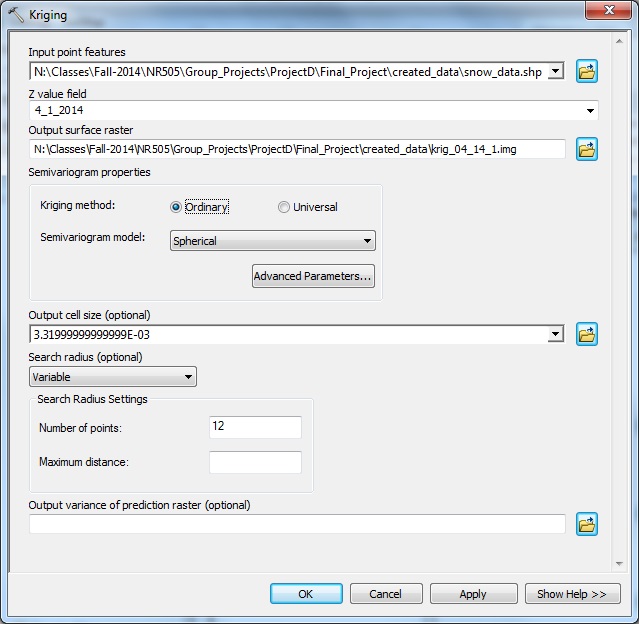
We also tried a more advanced interpolation method, kriging, to see if it yielded better interpolated results.
- Selected the accumulated point data as the input point features
- Selected the snow depth for the first month (Nov 2011) as the z (magnitude) field
- Ran the tool 18 times (once for every month) to yield rasters for every snow month during our three year analysis period. This process is simplified by using a model (shown in the flowchart section)
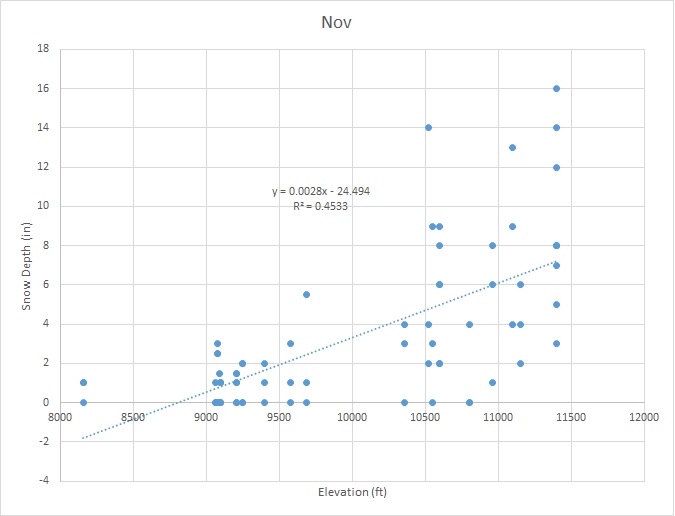
Because elevation can have significant effects on snowfall, we wanted to analyze the relationship between elevation and snow depth in our data to see if it had predictive capabilities for the ski resort totals. We opened the attribute table and exported our point data to Microsoft Excel, where we fit linear regression lines to our point data and used these to predict snow depths at the ski resort elevations.